Hi,
Thanks for such a great addon. I have a question regarding grid state: How to persist grid state after reload. I mean if the user interacts with the grid and changes column order, sorting, grouping, etc. How to persist these changes on reload. Is there a callback to handle those events?
1 Like
Just curious if anyone managed to get that nested structure up and running somewhere.
1 Like
@PablocFonseca This is amazing work! Thank you
I’ve been trying to figure out how to change the background color of rows depending on a single column value. Would appreciate your help on this.
1 Like
Amazing library @PablocFonseca!
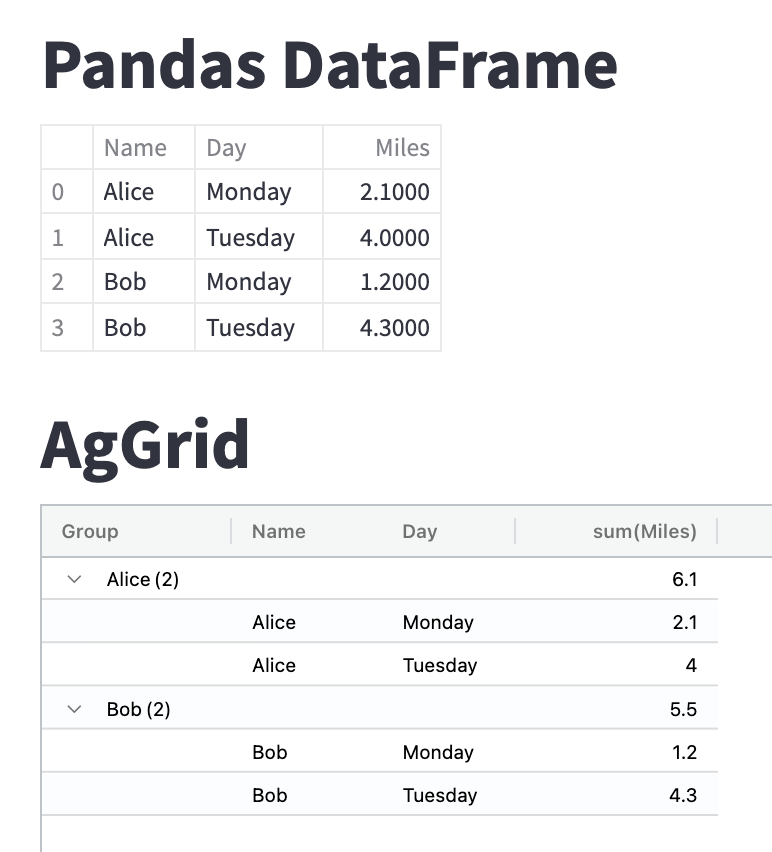
For those who were asking, I worked out a near-minimal example of grouped rows:
import streamlit as st
import pandas as pd
from st_aggrid import GridOptionsBuilder, AgGrid

df = pd.DataFrame({
    'Name': ['Alice','Alice', 'Bob','Bob'],
    'Day': ['Monday','Tuesday','Monday','Tuesday'],
    'Miles': [2.1,4,1.2,4.3]
})

ob = GridOptionsBuilder.from_dataframe(df)
ob.configure_column('Name', rowGroup=True)
ob.configure_column('Miles', aggFunc='sum')

st.markdown('# Pandas DataFrame')
st.write(df)

st.markdown('# AgGrid')
AgGrid(df, ob.build(), enable_enterprise_modules=True)
4 Likes
Can you help me find what’s wrong here
Any idea why this is not working
If i move sis’s code inside a st.button block, row selection is not returning anything
import numpy as np
import pandas as pd
import streamlit as st
from st_aggrid import AgGrid, GridOptionsBuilder, shared

np.random.seed(42)


def fetch_data():
    dummy_data = {
        "date": pd.date_range("2020-01-01", periods=5),
        "group": list("AAABB"),
        "apple": np.random.randint(0, 10, 5),
        "banana": np.random.randint(0, 10, 5),
        "chocolate": np.random.randint(0, 10, 5),
    }
    return pd.DataFrame(dummy_data)


def display_table(df: pd.DataFrame) -> AgGrid:
    # Configure AgGrid options
    gb = GridOptionsBuilder.from_dataframe(df)
    gb.configure_selection("single")
    return AgGrid(
        df,
        gridOptions=gb.build(),
        # this override the default VALUE_CHANGED
        update_mode=shared.GridUpdateMode.MODEL_CHANGED,
    )


x = st.button("display table")
if x:
    t = display_table(fetch_data())
    st.json(t["selected_rows"])

@PablocFonseca Could you please check what is wrong here ? I’m using version 1.0.0
That’s amazing! I’ll include this on example folder if github!
1 Like
Hi @pecoho, you can take advantage of st.session_state to properly mix button press and row selection. A possible solution is in the below snippet
Snippet
import numpy as np
import pandas as pd
import streamlit as st
from st_aggrid import AgGrid, GridOptionsBuilder, shared

np.random.seed(42)


def fetch_data():
    dummy_data = {
        "date": pd.date_range("2020-01-01", periods=5),
        "group": list("AAABB"),
        "apple": np.random.randint(0, 10, 5),
        "banana": np.random.randint(0, 10, 5),
        "chocolate": np.random.randint(0, 10, 5),
    }
    return pd.DataFrame(dummy_data)


def display_table(df: pd.DataFrame) -> AgGrid:
    # Configure AgGrid options
    gb = GridOptionsBuilder.from_dataframe(df)
    gb.configure_selection("single")
    return AgGrid(
        df,
        gridOptions=gb.build(),
        # this override the default VALUE_CHANGED
        update_mode=shared.GridUpdateMode.MODEL_CHANGED,
    )

# Initialize 'display_table' to False (if needed)
if 'display_table' not in st.session_state:
    st.session_state.display_table = False

columns = st.columns(2)

# Buttons to display/hide table
with columns[0]:
    if st.button("display table"):
        st.session_state.display_table = True
with columns[1]:
    if st.button("hide table"):
        st.session_state.display_table = False

# We display table based on session_state
# instead of button press: the former is preserved
# at re-run, while the latter isn't
if st.session_state.display_table:
    t = display_table(fetch_data())
    st.json(t["selected_rows"])
1 Like
Great library @PablocFonseca 
Is it possible to delete a row from the table?
Thanks!
Brilliant package, great work @PablocFonseca! I wonder how easy it would be to implement a pinned/frozen row as mentioned in React Data Grid: Row Pinning .
Did you try using PinnedTopRowData in gridOptions?
Thanks for the suggestion! I did try various versions of
AgGrid(df, pinned_top_row_data= df.iloc[0].values)
but couldn’t get it to work.
I also tried
 gb.configure_grid_options(
        pinned_top_row_data= df.iloc[0].values.tolist())
to no avail.
Check this example.
Basically you need to:
data = pd.DataFrame(..., columns=['a','b'])
gb = GridOptionsBuilder.from_dataframe(data)
go = gb.build()
go['pinnedTopRowData'] = [{'a':'100', 'b':'200'}]
1 Like
Worked like a charm, thanks very much! Once again, brilliant work 
Has anyone managed to implement grid alignment (React Data Grid: Aligned Grids)?
gridOptions["alignedGrids"]= [gridOptions_of_other_grid]
doesn’t seem to work…
I have 2 dataframes to show some charts.
Is it possible to deselect a row in a dataframe, if i select a row in an other dataframe?
gb1.configure_selection(selection_mode=“single”)
gridOptions1 = gb1.build()
opt = AgGrid(df_opt, gridOptions=gridOptions1, height=150, fit_columns_on_grid_load=True, allow_unsafe_jscode=True, update_mode=GridUpdateMode.SELECTION_CHANGED)
Thank you
Hello Pablo! This component is amazing and helpfull! Congrats!
I have a doubt when I need to create a dinamic column to sum values of others columns for example. This column data isn´t appear on returned grid data. It´s only for display on grid. How I can set this column to be returned on grid data?
Code:
df = pd.DataFrame({‘A’: [10, 20, 30],‘B’: [100, 200, 300]})
gb = GridOptionsBuilder.from_dataframe(df)
gb.configure_column(‘Sum’, valueGetter=‘Number(data.A) + Number(data.B)’, type=[‘numericColumn’])
go = gb.build()
ag = AgGrid( df, gridOptions=go, height=200, reload_data=False )
st.write(‘Returned grid data:’)
st.write(ag[‘data’])
How I can include the data from ‘Sum’ column on returned grid data?

Thanks for the awesome component! I really like how many enterprise functionalities work out of the box (plotting, row grouping, pivoting). However I tried using sparklines by providing a list column but nothing is rendered on screen:
gb.configure_column(
    "Spark",
    cellRenderer="agSparklineCellRenderer"
)
Is it because list columns are not supported here in grid options builder? Do you think this feature could be added?
thanks a lot

Try adding the column (Sum) to the pandas data frame, before configuring it. (You can easily Google it)