DuplicateWidgetID: There are multiple widgets with the same key='todo1'. To fix this, please make sure that the key argument is unique for each widget you create

Hi everyone!

I’ve a problem with st.select_slider, previously I was implementing this code:

dai_dose = st.select_slider(‘Daily dose’,options=[1,2,3,4,5,6,7,8,9,10], key=“pk”)

# dose_per_day = st.select_slider('Dose per day',options=[1,2,3,4,5,6,7,8,9,10], key="pk2")
# day=st.select_slider('Days',options=[1,5,10,15,20,25,30,35,40,45,50,55,60], key="pk3")

And the error was the same than now, my code now is:

unique_value = 0
selected_values = {} # Diccionario para almacenar los valores seleccionados

for todo in ['Daily dose', 'Dose per day', 'Days']:
    unique_value += 1
    key = f"todo{unique_value}"
    selected_values[key] = st.select_slider(todo, options=list(range(1,61)), key=key)

Please, could you help me?

1 Like

Hey @PARODBE :wave:

One thing you might want to do to tackle the DuplicateWidgetID error in Streamlit is to ensure that every widget has its own unique key.

Check your key-generating logic, especially the part where you create keys like f"todo{unique_value}", and ensure it’s properly incrementing unique_value as it should.

I hope that makes sense, and let me know if you’d need any more support.

Best wishes,
Charly

1 Like

Hi @Charly_Wargnier,

thank you for your fast response. I’m going to put more details about my code because I’m assigning different keys and the issue persist:

def pk_graphs():

# unique_value = 0
# selected_values = {}  # Diccionario para almacenar los valores seleccionados
# items=['Daily dose', 'Dose per day', 'Days']
# for todo,r in zip(items,range(1,4)):
#     key = f"todo{r}"
#     selected_values[key] = st.select_slider(todo, options=list(range(1, 61)), key={key})
#     r+=1

# # Ahora puedes acceder a los valores seleccionados a través del diccionario selected_values
# dai_dose = selected_values['todo1']
# dose_per_day = selected_values['todo2']
# day = selected_values['todo3']
# row_columns = row_container.columns((3, 2, 1))

dai_dose = st.select_slider('Daily dose',options=[1,2,3,4,5,6,7,8,9,10], key={"pk1"})
dose_per_day = st.select_slider('Dose per day',options=[1,2,3,4,5,6,7,8,9,10], key={"pk2"})
day=st.select_slider('Days',options=[1,5,10,15,20,25,30,35,40,45,50,55,60], key={"pk3"})


if st.button("Run PK Analysis"):
    with st.spinner("Building graphs..."):

        time.sleep(5)
        if 'df_result' in st.session_state:
            
            df_result = st.session_state['df_result']
            
            X_test, y_test = fingerprints_inputs2(df_result)

            df_nuevo_def3=df_result[['FUB','CLint','Doses max','Activity']].copy()

            smi=df_result.Smiles.tolist()
            
            mwt=[rdkit.Chem.Descriptors.ExactMolWt(Chem.MolFromSmiles(m)) for m in smi]
            
            df_nuevo_def3.insert(loc = 4,
                    column = 'MW',
                    value = mwt)
            
            logp=[rdkit.Chem.Crippen.MolLogP(Chem.MolFromSmiles(m)) for m in smi]
            df_nuevo_def3.insert(loc = 5,
                    column = 'LOGP',
                    value = logp)
            
            df_nuevo_def3['CAS_fake']=[f'0-0-0-{i}' for i in range(1)]
            df_nuevo_def3['DTXSID_fake']=[f'DTXSID-{i}' for i in range(1)]
            df_nuevo_def3['fake_name']=[f'A-{i}' for i in range(1)]

This a function in which there is more code, but it is not need for this purpose, and it is a part of a multipage:

page_names_to_funcs = {
“Intro”: intro,
“Input data”: input_data,
“PK_analysis”:pk_graphs,
“Metamodel”:calculations
}

demo_name = st.sidebar.selectbox(“Choose an option”, page_names_to_funcs.keys())

page_names_to_funcsdemo_name

if demo_name == “Intro”:
intro()
elif demo_name == “Input data”:
input_data()
elif demo_name == “PK_analysis”:
pk_graphs() # Simplemente mostrará los deslizadores y el botón
elif demo_name == “Metamodel”:
calculations()

if demo_name == “PK_analysis” and st.session_state.get(‘df_result’) is not None:
pk_graphs() # Si se ha seleccionado “PK_analysis” y se ha definido df_result, se ejecutarán los cálculos

Could you help me please? I don’t identify the error…
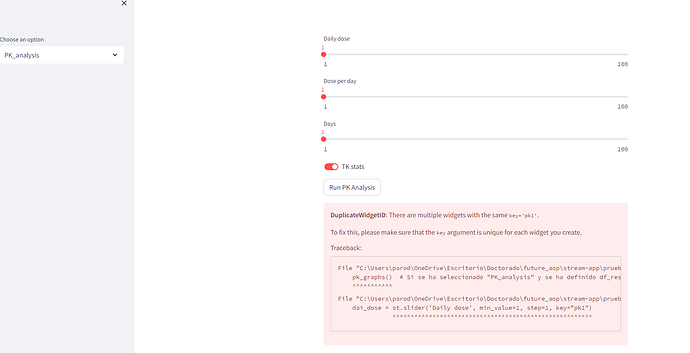
1 Like

Hey @PARODBE

Could you try:

dai_dose = st.select_slider('Daily dose', options=[1,2,3,4,5,6,7,8,9,10], key="pk1")
dose_per_day = st.select_slider('Dose per day', options=[1,2,3,4,5,6,7,8,9,10], key="pk2")
day = st.select_slider('Days', options=[1,5,10,15,20,25,30,35,40,45,50,55,60], key="pk3")
1 Like

Hey @Charly_Wargnier , thank you for your support, and yes, I tried and I obtained the same error…any idea?

1 Like

Please could you send a link to the repo? I’ll have a further look.

Best wishes,
Charly

1 Like

Thanks for your help @Charly_Wargnier, I just shared with you an invitation to my private repo (only code), as I would like to publish an article about this app as it is part of an article I already published from my doctorate. Link to my repo: https://github.com/PARODBE/chol_app

The problem is between 191-193 code lines.

Thank you very much for the help again!

Hey @PARODBE . The link is not working. Once recheck it.

Thanks, @PARODBE.

As @Guna_Sekhar_Venkata suggested, could you make a public repo available, if possible, to allow others to contribute towards finding a fix?

Best,
Charly

For sure @Guna_Sekhar_Venkata and @Guna_Sekhar_Venkata, I could make the code public but removing the parts that are not necessary to answer the problem, because as I said my idea is to publish the app in an article as a continuation of another one. Let’s see if you can help me find the solution for the moment, have you been able to access through the invitation?

By the way @Charly_Wargnier, I’m also going to use your tutorial code to implement previous and next button in charts, is there any easier way or not by the moment?

Thank you!

Great to hear about the implementation of previous/next buttons, @PARODBE!

I’ve likely come up with various code snippets for it over the years. Which one are you referring to? :slight_smile:

Best,
Charly

This one!

The problema is that I’m generating R Code with which I get some graphs, and I am not sure how implement It, likely saving the graph information in a list of dataframes, for example?

Not the only option, but you can use rpy2, a popular library for running R code from Python.

Consider using st.session_state to create and save the graphs, then gather their file paths into a list. This approach should help you achieve what you’re after, although I haven’t tested it myself.

Let me know how it goes :slight_smile:

Best,
Charly

Hi @Guna_Sekhar_Venkata , i’ve done public my repository removing Code and keeping the most important for helping me. @Guna_Sekhar_Venkata and @Charly_Wargnier , please select Sketcher optio and work with the default molecular (CCO) and put name for example ‘Charly’, dose=100, fub=0.5 and CLint=100, save molecule and select pk_calculations, in this page you’ll see the error with the three st.slider…Thank you!

Hey @PARODBE where did I mention to remove the parts of your code??

Ey @Guna_Sekhar_Venkata , I’ve removed the unnecessary parts which aren’t related to the issue.

Hi @Charly_Wargnier just to inform you that the problem persists, meanwhile I’ve implemented your code for previous and next buttons. It’s very curious because when I press next button the graph moves to the top of the application:

Before of pressing run button this is the image:

After of first running and before of pressing next button:

And after of pressing next button:

Any idea to fix that???

And please if you have any solution for the duplicatewidgetID it would be nice, thank you!

Hi,

Was there any solution to this? I always get this error and then after my selection it clears.

This topic was automatically closed 180 days after the last reply. New replies are no longer allowed.