Event Handling of pydeck_chart map in streamlit

Hello,

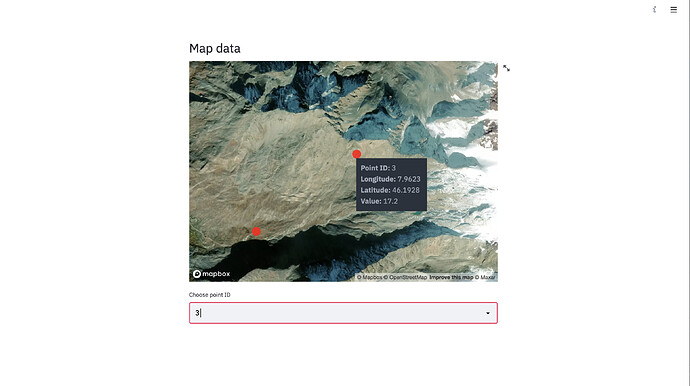
I was able to plot GPS points containing latitude and longitude information from a pandas dataframe into a pydeck_chart Scatterplot Layer. I included custom tooltips and finally wrapped all into a small streamlit app.

I was wondering if someone of you knows how to handle interactivity such as event handling/picking using PyDeck charts with Streamlit? In my example I would like to be able to extract the PointID of a clicked point and reuse it (e.g. as a variable) with further streamlit components. This would allow the output of an on_click event to be reused further in streamlit (e.g. for a plot or subsetting/filtering a dataframe).

I tried to include a minimal working example below.

    import streamlit as st
    import pydeck as pdk
    import pandas as pd
    import ssl

    # get rid of ssl connection error (certificates)
    try:
        _create_unverified_https_context = ssl._create_unverified_context
    except AttributeError:
        pass
    else:
        ssl._create_default_https_context = _create_unverified_https_context

    st.header("Map data")
`# read in data`
    df = pd.read_csv(r'https://gist.githubusercontent.com/bafu-DF/f60bd9ac9579d9f830f1f52ce7e79c86/raw/af16f3bb04d5150cc0e139d25d9c706ccbb80215/sampledata.csv', sep=',')

    layer = pdk.Layer(
        "ScatterplotLayer",
        df,
        pickable=True,
        opacity=0.8,
        filled=True,
        radius_scale=2,
        radius_min_pixels=10,
        radius_max_pixels=500,
        line_width_min_pixels=0.01,
        get_position='[Longitude, Latitude]',
        get_fill_color=[255, 0, 0],
        get_line_color=[0, 0, 0],
    )

    # Set the viewport location
    view_state = pdk.ViewState(latitude=df['Latitude'].iloc[-1], longitude=df['Longitude'].iloc[-1], zoom=13, min_zoom= 10, max_zoom=30)

    # Render
    r = pdk.Deck(layers=[layer], map_style='mapbox://styles/mapbox/satellite-v9',
                 initial_view_state=view_state, tooltip={"html": "<b>Point ID: </b> {PointID} <br /> "
                                                                 "<b>Longitude: </b> {Longitude} <br /> "
                                                                 "<b>Latitude: </b>{Latitude} <br /> "
                                                                 "<b> Value: </b>{Value}"})
    r

    # output of clicked point should be input to a reusable list
    selectedID = st.selectbox("Choose point ID", df['PointID'])

Thank you so much streamlit team for all your work and developing this awesome framework!
4 Likes

Hi @bafu-DF, welcome to the Streamlit community!

Your use case makes perfect sense. Because of the many variations on how this could go (not just with pydeck, but any JavaScript-based library), we created the Streamlit components framework:

https://docs.streamlit.io/en/stable/publish_streamlit_components.html#prepare-your-component

It may be in the future that we add the functionality you are imagining to Streamlit, but in the meantime, using the Components framework is the quickest way to accomplish this.

Best,
Randy

1 Like

Sorry if this seems like a stupid question, but how do people get the satellite map styles working. I have spent two days trying to figure it out but no luck. I only manage to get the carto - dark and light styles rendered on the html page. However, no luck using mapbox styles even after using the API keys. Moreover, even carto- satellite style does not work. Can anyone help?

1 Like

Hi @sumedh_bandodkar, welcome to the Streamlit community!

Are you passing your API key through the Streamlit configuration?

Best,
Randy

2 Likes

Hi! I have the exact same usecase as @bafu-DF, has there been any update on implementing pydeckโ€™s event handlers in streamlit? If not, can you elaborate on how I can recreate this functionality using Streamlit components? I red your provided link, but I canโ€™t seem to make the link to OPโ€™s question.

1 Like

Iโ€™d also like to interact with my pydeck_charts in streamlit. Is there any news on this?

I realise I spent two days rewriting my colleagues app from folium, but came to a sudden stop as I need to handle click events on map markers. I learned a lot though, as Iโ€™m more used to Dash. Streamlit is great!

1 Like

The link pointed to the last part (publishing) likely by mistake. Start here:

1 Like

Any update on this, gonna be very useful indeed! Thx

3 Likes

Any update?

1 Like