I want to create a chart where the input data can be changed dynamically on the chart itself (think of an music equalizer) and hence the data frame gets updated. I actually want to create a vehicle speed vs time chart where i can manipulate the vehicle speed by changing the chart points directly.
Is there a way to do this? The data frame changes can reflect on the chart - but can it be done vice-versa - where chart can be changed by interacting with it and hence the corresponding data gets updated?
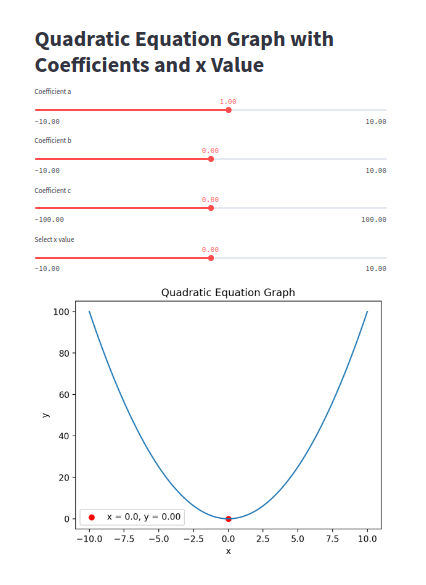
So am using sliders to determine coefficients of a quadratic equation
and a slider to point x
import streamlit as st
import numpy as np
import matplotlib.pyplot as plt
st.title("Quadratic Equation Graph with Coefficients and x Value")
a = st.slider("Coefficient a", -10.0, 10.0, 1.0)
b = st.slider("Coefficient b", -10.0, 10.0, 0.0)
c = st.slider("Coefficient c", -100.0, 100.0, 0.0)
x_value = st.slider("Select x value", -10.0, 10.0, 0.0)
x = np.linspace(-10, 10, 400)
y = a * x**2 + b * x + c
selected_y = a * x_value**2 + b * x_value + c
fig, ax = plt.subplots()
ax.plot(x, y)
ax.scatter(x_value, selected_y, color='red', label=f'x = {x_value}, y = {selected_y:.2f}')
ax.set_xlabel('x')
ax.set_ylabel('y')
ax.set_title('Quadratic Equation Graph')
ax.legend()
st.pyplot(fig)