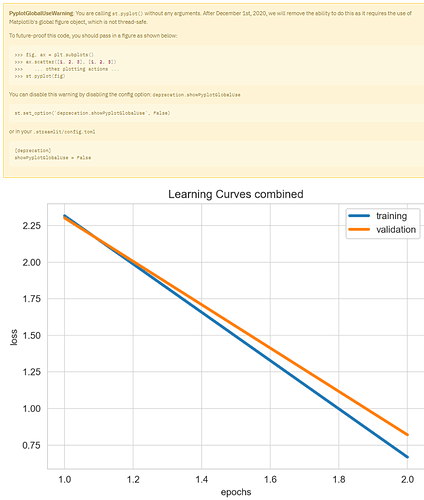
Hi folks and happy new year! 
I’m building a Streamlit app for the (awesome!) Ludwig and I cannot seem to display the vizzes I need.
After training a model, the following code in Colab:
from ludwig import visualize
visualize.learning_curves([data])
… diplays all the needed charts:


More info about visualisaton methods here
In streamlit, I’ve converted the code as:
st.pyplot(visualize.learning_curves([data]))
… yet this code only gives me the ‘loss’ chart, see screenshot below:
I’ve tried to tweak the code in several ways but no luck so far. Any ideas anyone?
Thanks in advance! 
Charly


