Hi!
Has anyone successfully implemented altair maps on their streamlit apps?
I keep getting this error
the code itself is just reading a shapefile:
import geopandas as gpd
import altair as alt
import streamlit as st
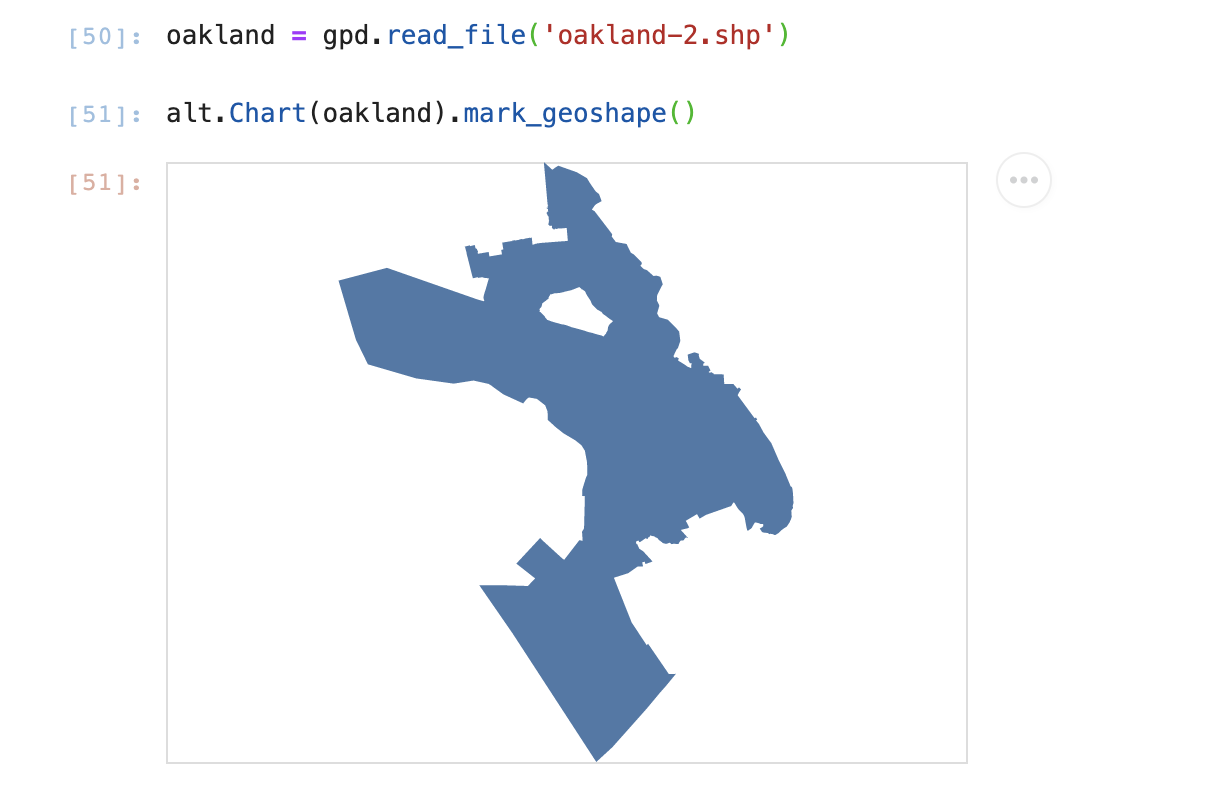
test = gpd.read_file('oakland-2.shp')
chart = alt.Chart(test).mark_geoshape()
st.altair_chart(chart)
it seems to work fine in jupyter lab
any help would be greatly appreciated!
Hi @chekos !
Unfortunately, Streamlit’s internals don’t natively handle the geometry dtype from geopandas, so you need to work around this type and convert it into some native dtype Streamlit can handle.
You can take a look at this solution and this solution and see if one of those helps.
Do tell us about your progress !
Cheers,
Fanilo
Thanks!
This is very helpful.
I tried changing the geodataframe to a json object and I think I’m getting closer to a solution but it still doesn’t work.
import geopandas as gpd
import altair as alt
import streamlit as st

test = gpd.read_file('oakland-2.shp')
inline_data = alt.InlineData(test.to_json())
chart = alt.Chart(inline_data).mark_geoshape()
st.altair_chart(chart)
It works on jupyter lab but not on streamlit
Now, I don’t get any errors - I just can’t see the data 
Hmmm yeah, something’s odd in the compiled Vega on Streamlit’s side. In Jupyterlab the values of the shape are inlined in the compiled Vega but they don’t appear on Streamlit’s side.
I’m not sure, it looks like Streamlit’s marshalling deletes Altair Inline data but that does look strange, let’s dig further 
Have there been updates? I am getting a similar error:
ArrowTypeError: ('Did not pass numpy.dtype object', 'Conversion failed for column geometry with type geometry')
Here is a minimal code example, distinguishing two ways to load the topojson file:
- Load topojson from remote URL using altair (
alt.topo_feature()): works in Streamlit and Juypter Notebook
- Load exact same topojson locally using geopandas (
gpd.read_file()): ONLY works in Jupyter Notebook but not in Streamlit
import streamlit as st
import altair as alt
import geopandas as gpd

regions = alt.topo_feature("https://raw.githubusercontent.com/deldersveld/topojson/master/countries/italy/italy-regions.json", 'ITA_adm1')

map = alt.Chart(regions).mark_geoshape(
    stroke='white',
    strokeWidth=2
).encode(
    color=alt.value('#eee'),
)
st.altair_chart(map, use_container_width=False)

regions_local = gpd.read_file("italy-regions.json")
map2 = alt.Chart(regions_local).mark_geoshape(
    stroke='white',
    strokeWidth=2
).encode(
    color=alt.value('#eee'),
)
st.altair_chart(map2, use_container_width=False)
The above-mentioned workaround leads to an empty graph.