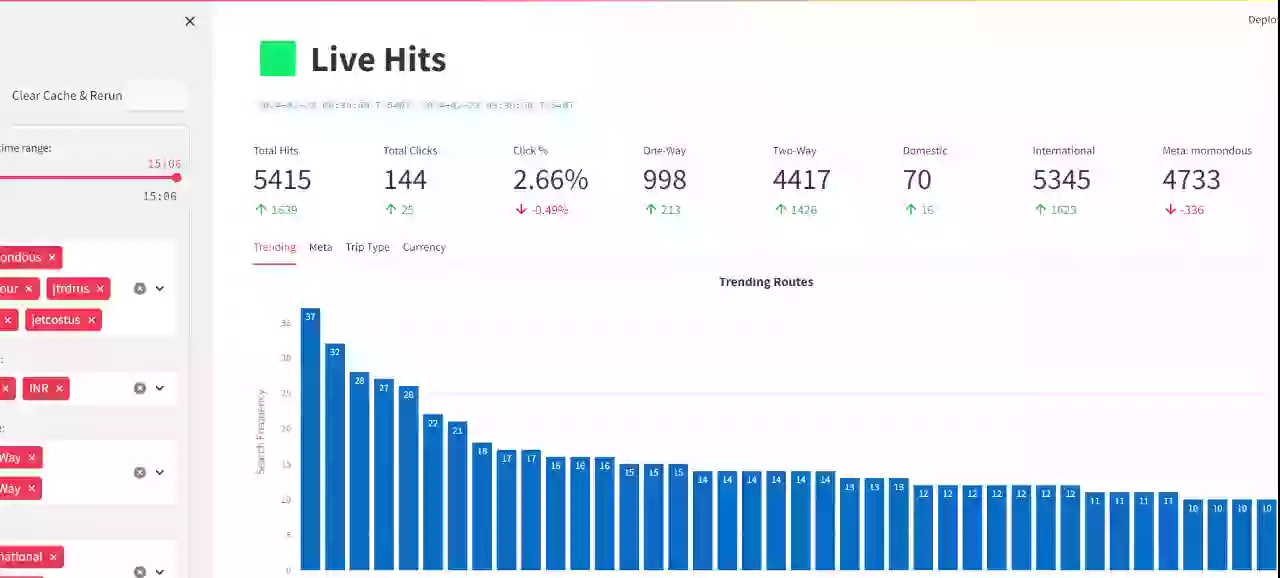
Yes, I have used catching option with functions where I am loading data from database or with functions which is computing or returning something. I am attaching a sample code for your reference to check, what i am doing wrong here. What is causing fliker between tabs. Please suggest me!
with t2.container():
    meta_group = filtered_df.groupby(by ="Meta").size().reset_index(name='Count').sort_values(by ="Count",ascending=False)
    fig3 = px.bar(meta_group, x='Meta', y='Count',text="Count",title="Trending Metas",color="Meta")
    fig3.update_layout(title={'x':0.5,'xanchor':'center'},
                              xaxis_title="Meta Names",
                                yaxis_title="Search Frequency",margin=dict(t=20))
    st.plotly_chart(fig3, use_container_width =True)
    st.divider()

    uniq_meta_from_filter = meta_group['Meta'].values
    for meta_name in uniq_meta_from_filter:
        col1,col2 = st.columns([1,4])
        specific_meta_grouped_routes = specific_meta_records.groupby(by ="Route").size().reset_index(name='Count').sort_values(by ="Count",ascending=False).head(40)
        fig4 = px.bar(specific_meta_grouped_routes, x='Route', y='Count',text="Count",height=300)
        fig4.update_layout(xaxis_title="Route Names",
                            yaxis_title="Search Frequency",margin=dict(l=100,t=20, b=5))
        fig4.update_xaxes(tickangle=45)
        total_search = len(specific_meta_records)
        uniq_route_counts = specific_meta_records.Route.nunique()
        col1.markdown(create_square_text_box(meta_name,total_search,uniq_route_counts),unsafe_allow_html=True)
        col2.plotly_chart(fig4, use_container_width =True)
        st.divider()


######################### Tab3

with t3.container():
    tripType_grouped = filtered_df.groupby(by ="TripType").size().reset_index(name='Count').sort_values(by ="Count",ascending=False)
    fig5 = px.bar(tripType_grouped, x='TripType', y='Count',text="Count",title="Trip Type",color="TripType")
    fig5.update_layout(title={'x':0.5,'xanchor':'center'},
                              xaxis_title="Type of Trip",
                                yaxis_title="Search Frequency",margin=dict(t=20))
    st.plotly_chart(fig5, use_container_width =True)
    st.divider()

with t3.container():
    uniq_tripType_from_filter = tripType_grouped["TripType"].values
    for tt in uniq_tripType_from_filter:
        col1,col2,col3 = st.columns([1,2,2])
        specific_trip_grouped_routes = specific_trip_records.groupby(by ="Route").size().reset_index(name='Count').sort_values(by ="Count",ascending=False).head(15)

        trending_meta_for_trips =  pd.DataFrame(specific_trip_records["Meta"].value_counts().reset_index())

        fig6 = px.bar(trending_meta_for_trips, x='Meta', y='count',text="count",height=300)
        fig6.update_xaxes(tickangle=45)
        fig6.update_layout(xaxis_title="Meta",
                            yaxis_title="Search Frequency",margin=dict(l=100,t=20, b=5))

        fig7 = px.bar(specific_trip_grouped_routes, x='Route', y='Count',text="Count",height=300)
        fig7.update_layout(xaxis_title="Route Names",
                            yaxis_title="Search Frequency",margin=dict(l=100,t=20, b=5))
        fig7.update_xaxes(tickangle=45)
        total_search = len(specific_trip_records)
        uniq_route_counts = specific_trip_records.Route.nunique()
        col1.markdown(create_square_text_box(tt,total_search,uniq_route_counts),unsafe_allow_html=True)
        col2.plotly_chart(fig6,use_container_width=True)
        col3.plotly_chart(fig7, use_container_width =True)
        st.divider()
