Hello!
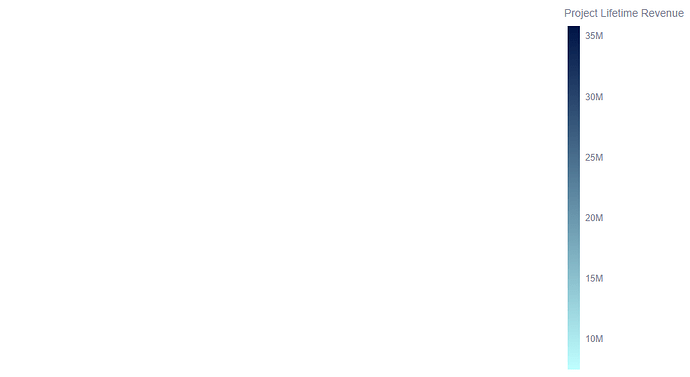
I’m working on a Streamlit app that’s living inside Snowflake. I would like to have a plotly choropleth included to represent some state-specific data, however, the chart isn’t getting drawn correctly. The plotly chart and color legend gets displayed, but the actual map of the states isn’t available.
I could provide code, but the same issue occurs regardless of what choropleth code I use, including the examples from plotly: Choropleth maps in Python . Additionally, I can’t use the “download plot as a png” feature in the plotly chart. My other plotly figures get drawn just fine so I think this is choropleth specific. Please let me know how I can fix this!
