pipers
August 6, 2020, 5:02pm
1
Hi!
Same experience here. I can only get latex to show in figures using matplotlib.
Same here, pretty annoying… Has this been fixed/hacked?
having the same problem. anyone? Bueller?
I guess it is not solved yet?
timL
December 2, 2021, 9:31pm
6
I’m also having the same issue. I notice that the plotly documentation notes that Mathjax may need to be separately loaded? Any ideas on how to do this?
Latex (plotly.com)
tengis
April 6, 2022, 6:38am
7
Any updates on this issue?
cualr
April 6, 2022, 4:03pm
8
I was able to create the following graph and using μg/m<sup>2</sup>, I was also able to deploy in the cloud. I hope this solves your use case, code is provided below:
import streamlit as st
fig = px.line(x=[1, 2, 3, 4], y=[1, 4, 9, 16], title=‘test title’)
fig.update_layout(
xaxis_title='test',
yaxis_title='μg/m<sup>2</sup>'
)
st.plotly_chart(fig)
edsaac
March 27, 2025, 12:30pm
9
I put an example in this GitHub issue about loading MathJax so Plotly can render Latex correctly:
opened 10:56PM - 26 Aug 22 UTC
type:bug
status:confirmed
priority:P3
feature:st.plotly_chart
### Summary
`st.plotly_chart()` does not render latex in plot elements.
The [… `include_mathjax`](https://plotly.com/python-api-reference/generated/plotly.graph_objects.Figure.html?highlight=include_mathjax) kwarg might take care of this but passing it to `st.plotly_chart()` makes no difference. Using raw strings or double dollar signs makes no difference either.
### Steps to reproduce
[](https://issues.streamlitapp.com/?issue=gh-5251)
Code snippet:
```python
import streamlit as st
import plotly.express as px
fig = px.scatter(x=[0, 1, 2, 3, 4], y=[0, 1, 4, 9, 16],
labels={'x':r"$x \to x^2$", 'y':"$x^2$"})
st.plotly_chart(fig) # No latex rendered
st.plotly_chart(fig,include_mathjax="cdn") # No latex rendered either
st.markdown(r"$x \to x^2$") # But streamlit latex (KaTex?) does work
```
**Expected behavior:**
The labels should be rendered as latex equations,
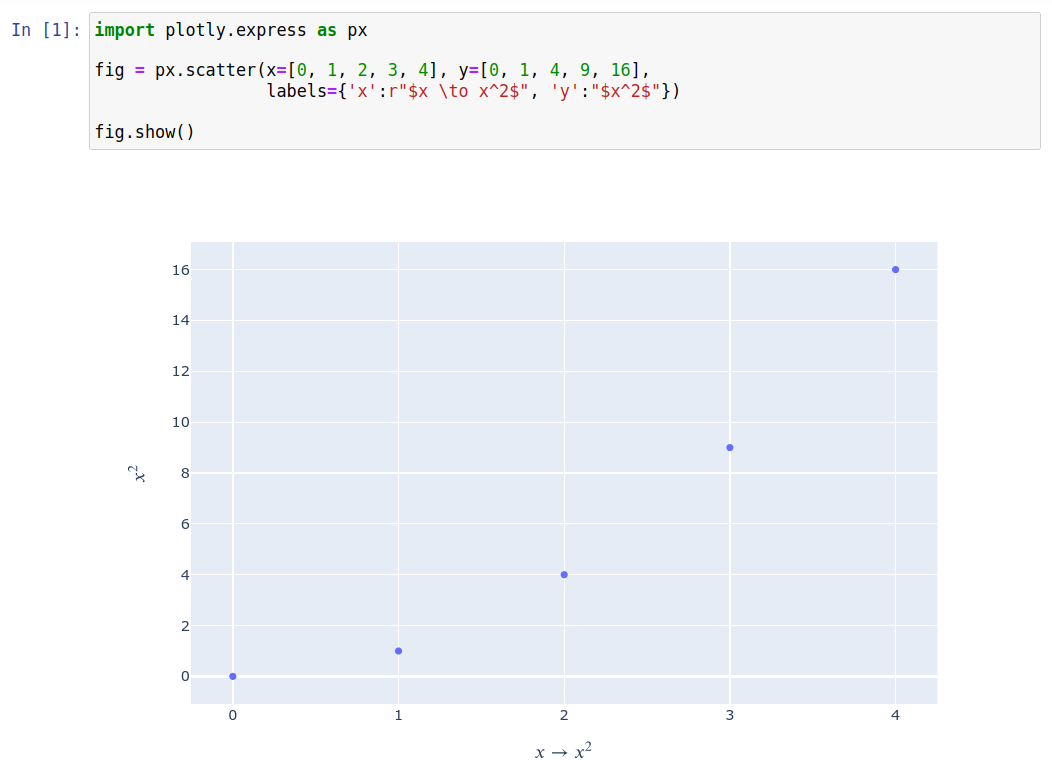
**Actual behavior:**
The literal strings are shown instead

### Is this a regression?
From [this discussion](https://discuss.streamlit.io/t/plotly-problem-using-latex-in-titles-and-axis-labels/4766), it seems that this has never worked :face_with_spiral_eyes: :skull:
### Debug info
- Streamlit version: 1.12.2
- Python version: 3.9.5
- Using pipenv
- OS version: Ubuntu 20.04.5 LTS
- Browser version: Firefox 104.0 (64-bit)
### Additional information
It has been mentioned in a couple discuss entries:
- https://discuss.streamlit.io/t/render-mathjax-library-in-streamlit/18081
- https://discuss.streamlit.io/t/plotly-problem-using-latex-in-titles-and-axis-labels/4766


