Streamlit is great. I am trying to use Seaborn. The correlation graph works fine. However, I am not able to get the Pairplot to work. Do you know if this can be made to work? It is working in Jupyter Notebook. Below is the code I am using. Thanks in advance.
if st.checkbox("Seaborn Pairplot",value=True):
import matplotlib
import matplotlib.pyplot as plt
import seaborn as sns
fig = plt.figure()
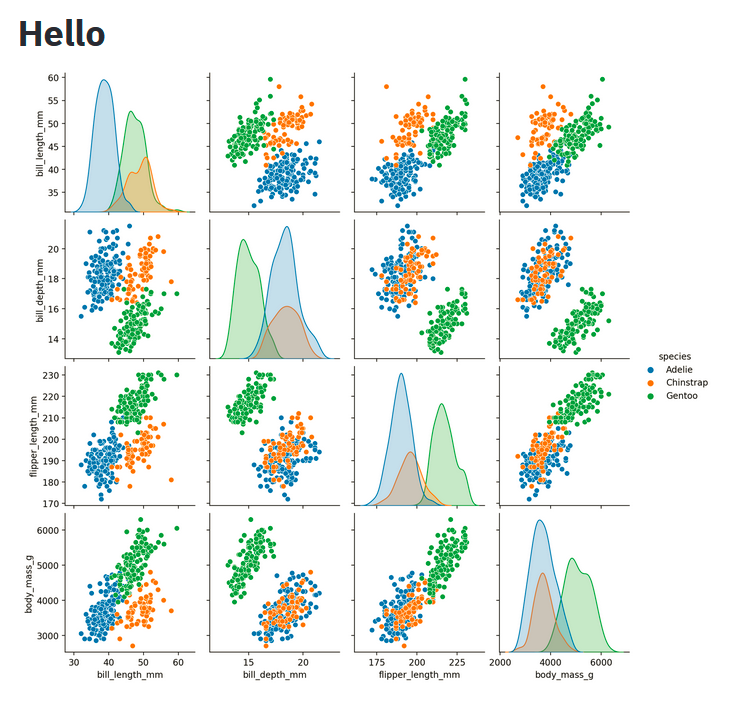
sns.pairplot(df, hue="SKU")
st.pyplot(fig)


 :
: