Hello! I have created my first Streamlit app, that showcases my new data visualization project called City Summit.

What it does?
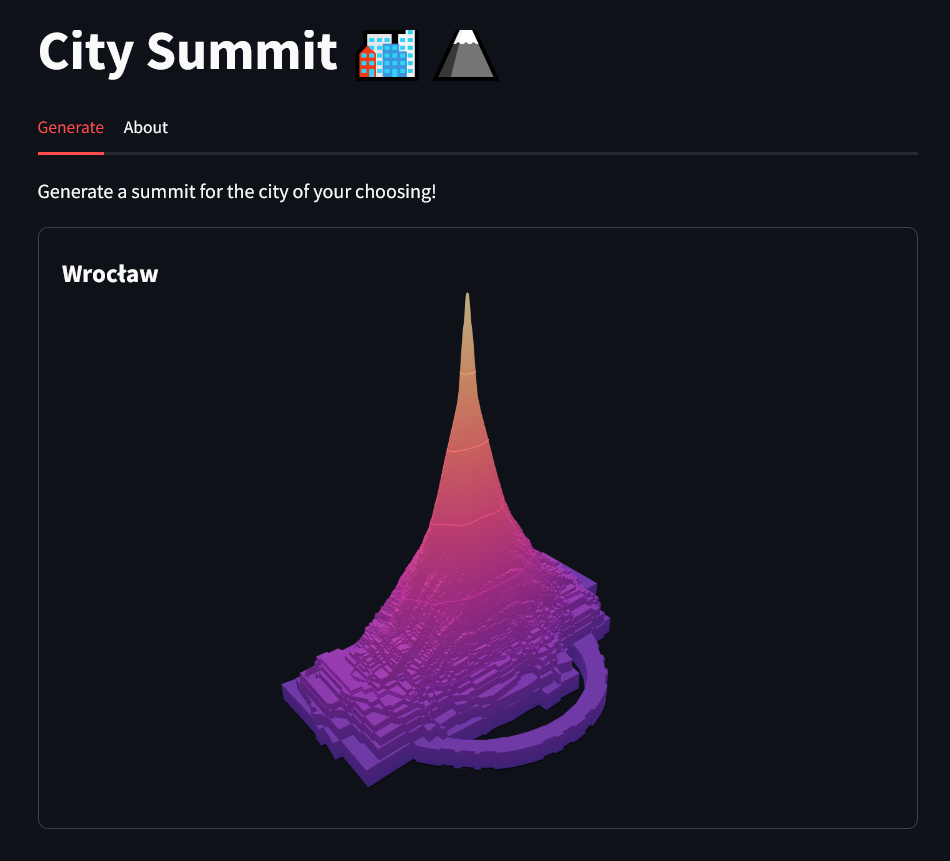
It generates a visualization of a heightmap built using building shapes from a given city.
You can select a city, palette and few more parameters, it will download the data from the Overture Maps dataset, rasterize it and display in 3D using Plotly. The generated heightmap can be downloaded as a numpy array.
There is also the About tab with more info.
The code will work slowly for bigger cities, because the code is memory intensive so I had to split the job into chunks using PyArrow batch processing.