Graphviz Chart Unreadable for Large Graphs

Hi,

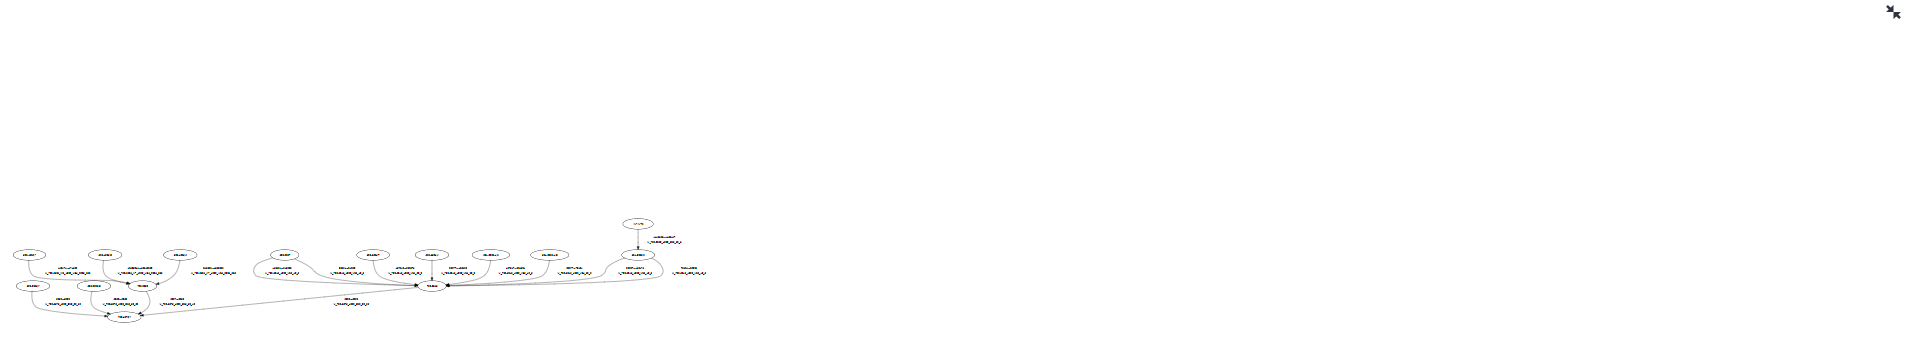
I am making a graphviz chart from a networkx object to show a (subcomponent β†’ component ) hierarchy for a any user component material.
It looks great for small hierarchies

But it quickly becomes unreadable once I pick deeper components – even when I expand the image

Is there any way I can do this ?
Also is there better way to dynamically show this data structure my current attempt to use networkx β†’ graphviz?
Thanks !

Hi @daniel8060

It seems that the graph’s nodes and edges are not wrapped within the page’s width. Have you tried pyvis and networkx in a Streamlit app.

I came across this thread on the forum where @napoles3d shows an example of pyvis in Streamlit:

And a blog on the use of pyvis that’s worth check out:

Hope this helps!

Best regards,
Chanin

This topic was automatically closed 180 days after the last reply. New replies are no longer allowed.