Hello,
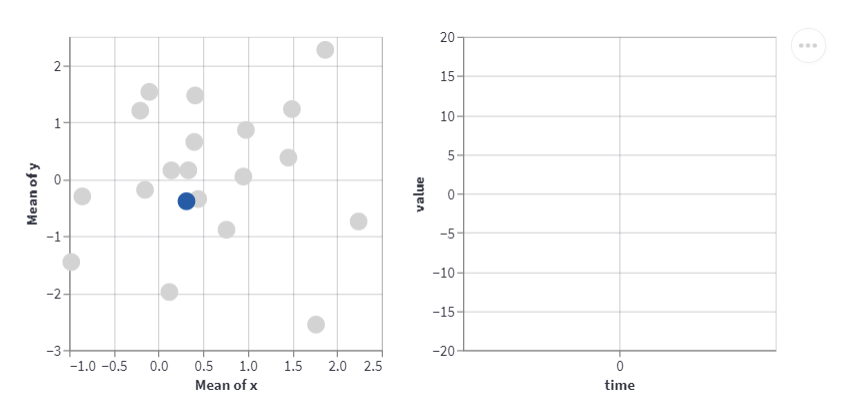
I am trying to plot a combination of scatter plot and time series, where each time series curve belongs to its corresponding point in the scatter plot. I want to have an interactive plot and I use altair for that purpose. I use exactly the same code that is shared in altair (here: Selection Detail Example — Altair 4.2.0 documentation) to create such interactive plot. When I run this code on my local computer, everything works very well. However, when I deploy the code and show it in share.streamlit.io, the time series are not synched with the scatterplot anymore. In fact, when all the points are selected, the time series is shown well for all points. However, as soon as I choose one specific point in the scatterplot, the time series disappear totally.
This problem is shown in the attached figures. I appreciate any hints/ comments about this problem.
Hi @mhajizadeh, welcome to the Streamlit community!! 

When I run this code on my local computer, everything works very well.
What version of Streamlit are you using? I tried all versions from 0.85.0, 0.86.0, …, to 1.3.1 and wasn’t able to reproduce the behavior where it “works well”. Clicking on any point in the scatterplot, locally and on Streamlit Cloud, causes the time series to disappear.
Strange that the following example works as expected, but not the one you linked: Interactive Scatter Plot and Linked Layered Histogram — Vega-Altair 5.2.0 documentation
Best, 
Snehan
Hi @snehankekre. Thanks for your reply. I use streamlit 1.3.1.
I know that it works with hist plots, but I am interested in plotting time-series and not bar plots. Do you have any recommendations about this?
@mhajizadeh I don’t know that I have your answer, but I came across two issues with Streamlit + Altair.
First, my local computer is Windows and Streamlit host is Linux. If you’re manipulating datetimes to strftime, Windows has at least one specific difference from Linux that was causing a bug in my code.
Otherwise, if you are using Altair to set ordinal time series values (i.e. skip weekend dates), this has caused some Altair interactivity issues for me.
@ryanlampkin thanks for your hints. Actually my local computer is Windows and that might be what you mentioned. My time data are not datetimes format, but are continuous numbers exactly as the one used in altair example, so lets consider them as a continuous range of (0,50). I do not specify their time neither as ordinal (O) nor as time (T). However, if I define the x and Y as T, it does not solve my problem.
I am curious to know how you overcome the problem of conflicts between windows and Linux version. Can you please share this?
That’s helpful to know. Yes, I don’t think our problems are the same. For datetime formatting, in my issue, Windows uses a # where linux required a -. Small but took me forever to figure out