Hi @snehankekre , thank you for your response.
I understand using the if method, but that can be pretty redundant when going through 27 topics. So I added the text, but I also need to make sure the freqdist is being added as well, all which depends on which topic was selected.
I’m not sure if adding a for loop or maybe filtering the topics would solve that.
I also have an issue displaying the data for my linechart to display the freqdist.
st.title("Project1")
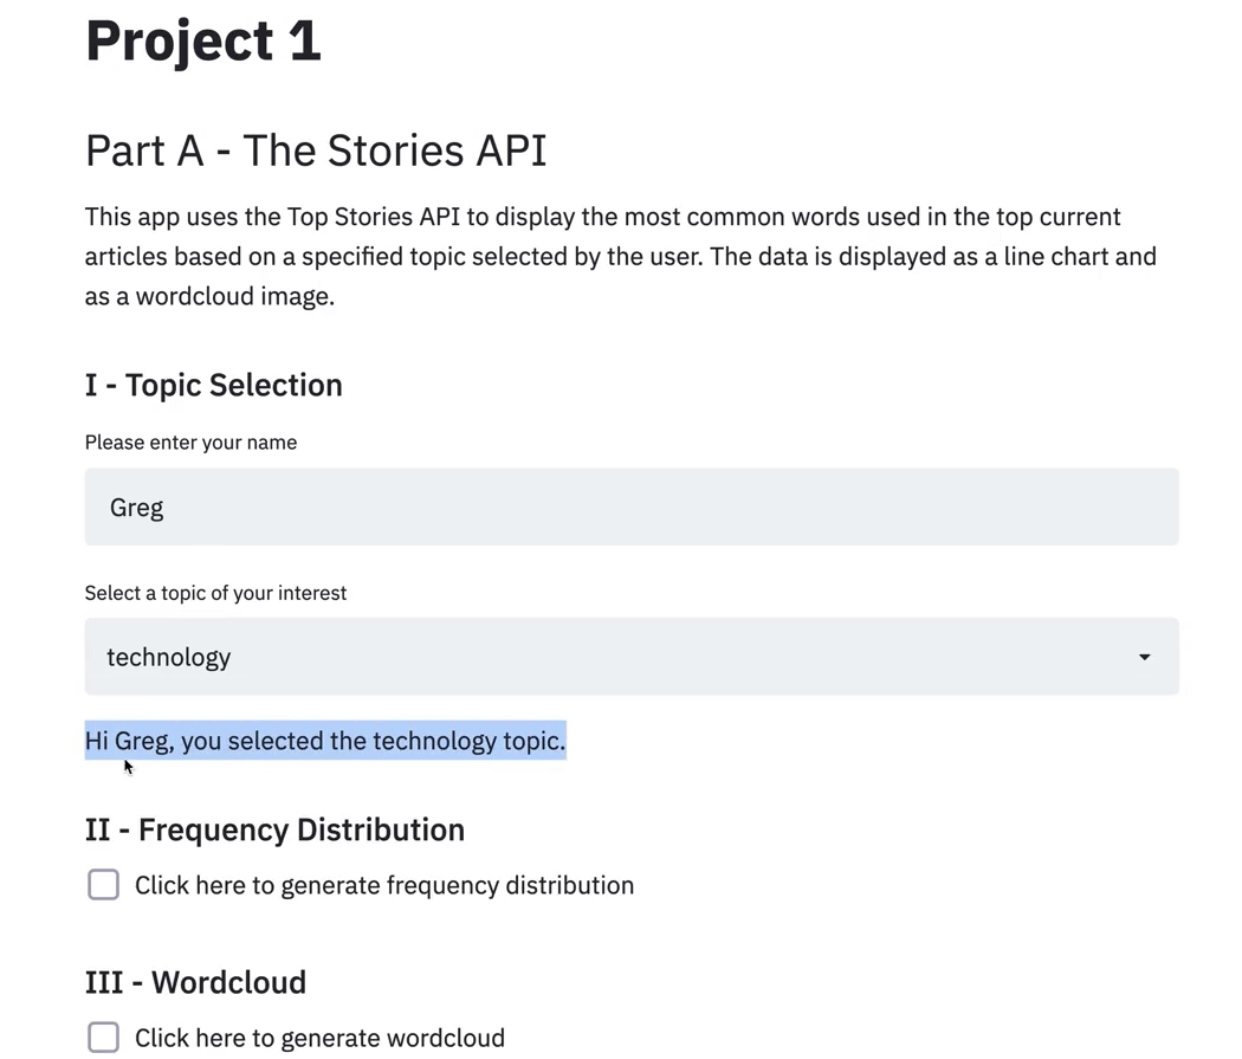
st.header("Part A - The Top Stories API")
st.markdown("This app uses the Top Stories API to display the most common words used in the top current \
articles based on a specified topic selected by the user. The data is displayed as line chart \
and as a wordcloud image.")
st.subheader("I - Topic Selection")
name = st.text_input("Please enter your name")
topic = st.selectbox(
"Select a topic of your interest",
["arts", "automobiles", "books", "business", "fashion", "food", "health", "home",
"insider", "magazine", "movies", "nyregion", "obituaries", "opinion", "politics",
"realestate", "science", "sports", "sundayreview", "technology", "theater", "t-magazine",
"travel", "upshot", "us", "world"]
)
if 'automobiles' in topic:
st.write("Hi " + name + ", you selected the " + topic + " topic.")
url = "https://api.nytimes.com/svc/topstories/v2/" + topic + ".json?api-key=" + api_key
response = requests.get(url).json()
main_functions.save_to_file(response, "JSON_Files/response.json")
my_articles = main_functions.read_from_file("JSON_Files/response.json")
str1 = ""
for i in my_articles["results"]:
str1 = str1 + i["abstract"]
sentences = sent_tokenize(str1)
words = word_tokenize(str1)
words_no_punc = []
for w in words:
if w.isalpha():
words_no_punc.append(w.lower())
stopwords = stopwords.words("english")
clean_words = []
for w in words_no_punc:
if w not in stopwords:
clean_words.append(w)
fdist = FreqDist(clean_words).most_common(10)
st.write(fdist)
st.subheader("II - Frequency Distribution")
if st.checkbox("Click here to generate frequency distribution"):
chart_data = pd.DataFrame(
np.random.rand(20, 2),
columns=['Words', 'Count']
)
st.line_chart(chart_data)
st.subheader("III - WordCloud")
if st.checkbox("Click here to generate wordcloud"):
wordcloud = WordCloud().generate(str1)
plt.figure(figsize=(12, 12))
plt.imshow(wordcloud)
plt.axis("off")
st.set_option('deprecation.showPyplotGlobalUse', False)
st.pyplot()
st.markdown("<p style='text-align: center;'>Wordcloud generated for " + topic + " topic.",
unsafe_allow_html=True)