I have copied source code from: Make your st.pyplot interactive!
into a local python script test.py
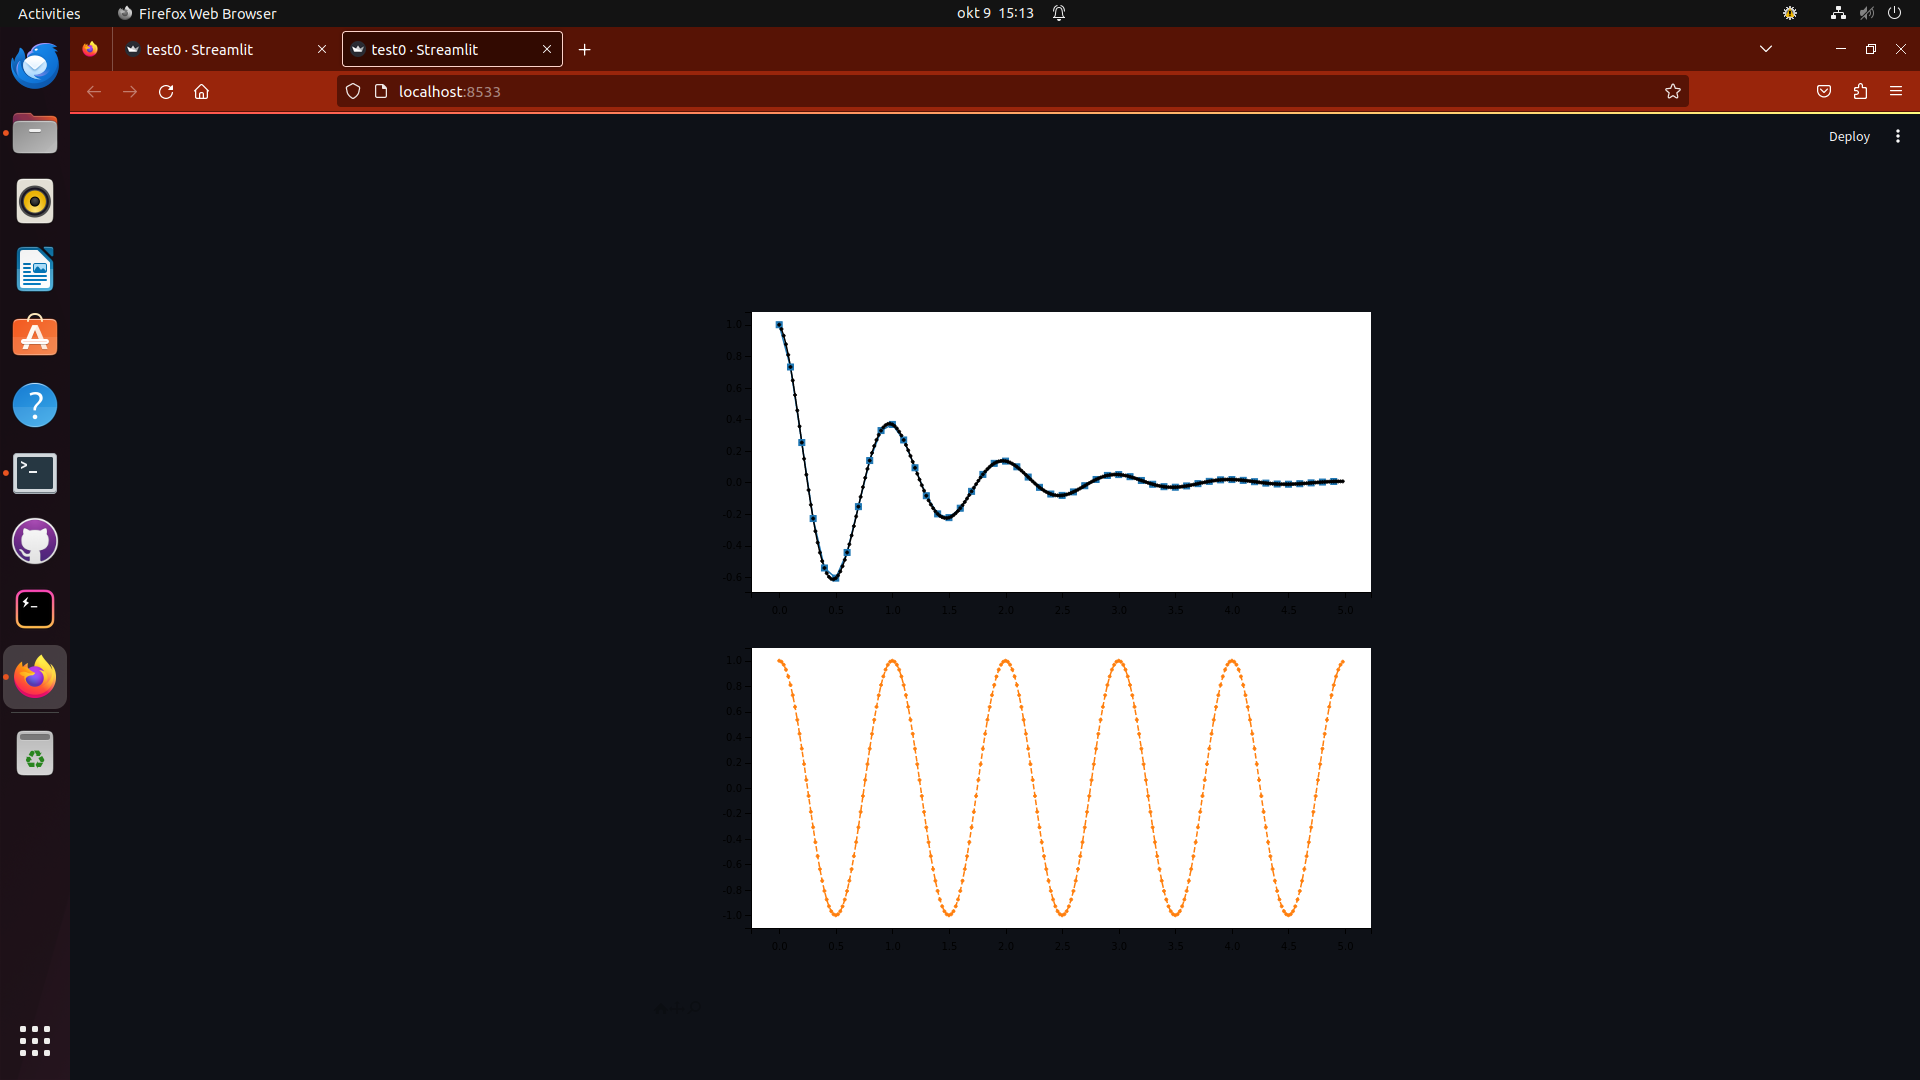
When I run the code with: “streamlit run test.py”, figures appear in my browser, however without axis.
Pls can someone explain why axis do not appear.
Hi @hesselmans,
Which version of Streamlit are you using?
Streamlit, version 1.27.2
Thanks, @hesselmans
@whuang do you know if this a known issue with newer versions of Streamlit?
Hi Charly,
do not know if this is a streamlit version issue. I have just started using streamlit.
Regards, Gerard
Hi @hesselmans ,
Can you make a bug report on GitHub?
Hi willhuang
Pls can you inform me how/where to enter this bug report.
Regards, Gerard
Dear Wilhuang
Please find attached the python script and a screenshot of what is visible in the browser.
Hopes this helps to solve the problem.
Files are in klad.zip.
Regards, Gerard
(Attachment klad.zip is missing)
Hi @hesselmans , here is how to submit a bug report:
Also, I think you tried attaching things but they don’t seem to be attached.
Yes, I tried to send a message with attachments.
However, certain types of attachments are blocked.
When I changed the extension of the attached files,
the message was rejected because content resembled the previous mail.