Hi, i have problem with one think. I have page with a few containers, and in them I fave tabs. When I change anything o select box, or whatever else page move up. Sometimes to top page sometimes less. Record below

Hey @Piotr
Welcome on our forum! Would love to help. That looks like a bug: can you manage to share how to reproduce it with some minimal code? Or the actual underlying code (with mock data if too sensitive)?
Thanks
in my opinion this is happened when on one page have many containers with tabs. I can give you link to my GitHub but on private massage?
Would rather have some reproducible code here so it can help anyone, please!
with st.container():
# odwoluje sie do funkcji ktore generuje caly modul odpowiedzialny za mailingi adresowe
main_action_config(data_to_show_ma, True)
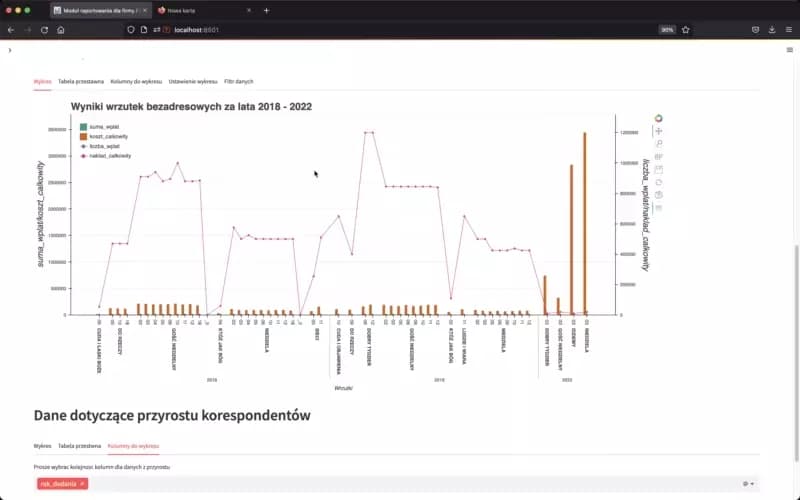
st.header('Dane z głównych wrzutek bezadresowych')
non_action_main_conf(data_to_show_db)
st.header('Dane dotyczące przyrostu korespondentów')
tab7, tab8, tab9 = st.tabs(['Wykres', 'Tabela przestwna', 'Kolumny do wykresu'])
with tab9:
levels_increase = st.multiselect(options=['rok_dodania', 'grupa_akcji_2', 'miesiac_dodania', 'kod_akcji'],
label='Prosze wybrac kolejnosc kolumn dla danych z przyrostu',
default=['rok_dodania'])
cam_inc_plot, test_pivot_inc = pivot_and_chart_for_dash(data_to_show_increase, levels_increase, 'increase',
'Wyniki pozyskania korespondentów za lata ',
'', {})
with tab7:
st.bokeh_chart(cam_inc_plot)
with tab8:
st.dataframe(test_pivot_inc)
main_action_config(data_to_show_ma, True) and non_action_main_conf(data_to_show_db) is function witch create first two char on my video. tab 7, 8, 9 create the last char form my wideo.
all functions go to this functions:
def pivot_and_chart_for_dash(data, multindex, type, title, x_label, dict):
    if (type != 'increase') & (type != 'dist'):
        temp_df = create_df(dict)
    data, gr3, from_, to_ = modifcate_data(data, type, multindex)
    data = change_name(data)
    if type == 'address':
        temp_df = change_short_names_ma(temp_df)
    elif type =='nonaddress':
        temp_df = change_short_names_db(temp_df)
    if (type != 'increase') & (type != 'dist'):
        y_label, y_sec_label = label_of_axis(temp_df)
    else:
        y_label = 'Ilość pozyskanych'

    index_for_char = data.groupby(multindex)

    pivot_table_ma = create_pivot_table(data, multindex, type)

    if (type != 'increase') & (type != 'dist'):
        max_value_for_y_prime = check_max_value(pivot_table_ma, temp_df, 'Oś główna')
        max_value_for_y_second = check_max_value(pivot_table_ma, temp_df, 'Oś pomocnicza')

    source = ColumnDataSource(pivot_table_ma)
    #todo dokonczyc tooltips tak aby po njaechaniu pokazywal wartosci
    TOOLTIPS = [
        ("index", "$index"),
    ("value", "@suma_wplat"),
    ("value2", "@liczba_wplat")]
    print(index_for_char.describe())
    #tworze figure do ktorej bede dolaczac wykresy
    p = figure(x_range=index_for_char,
               height=700, width=1500, title=f"{title}{from_} - {to_}",
               toolbar_location='right',
               x_axis_label=x_label,
               y_axis_label=y_label, tooltips=TOOLTIPS
               )
    p.title.text_font_size = '18pt'

    if (type != 'increase') & (type != 'dist'):
        p.y_range = Range1d(0, max_value_for_y_prime*1.1)

    if ((type != 'increase') & (type != 'dist')) and (max_value_for_y_second != 0):
        "dodaje druga os najpierw nazwe i zasieg potem layout i wykorzystuje nazwe i wkazuje strone"
        p.extra_y_ranges = {'secon_axis': Range1d(0, max_value_for_y_second*1.1)}
        p.add_layout(LinearAxis(y_range_name="secon_axis", axis_label=y_sec_label), 'right')
        p.yaxis.axis_label_text_font_size = "15pt"

    #wylaczam tryb naukowy, dzieki czemu pokazuja sie pelni liczby a nie ich potegi
    p.yaxis.formatter.use_scientific = False
    'petla w celu uwtorzenia polaczonych nazws kolumn multindexu potrzebnych do wykresu'
    str_mutlindex=''
    j = 0
    for i in multindex:
        if j == 0:
            str_mutlindex = i
            j += 1
        else:
            str_mutlindex = str_mutlindex + "_" + i

    # tworze wykresy
    if (type != 'increase') & (type != 'dist'):
        char_opt.char_ma_db_dash(temp_df, p, str_mutlindex, source, pivot_table_ma)
    else:
        pt_columns = pivot_table_ma.columns
        pt_columns = pt_columns.to_list()
        colors = itertools.cycle(palette)
        colors_fin = []
        for m, color in zip(range(len(pivot_table_ma.columns)), colors):
            colors_fin.append(color)
        p.vbar_stack(pivot_table_ma.columns, x=dodge(str_mutlindex, 0, range=p.x_range),  source=source,
                     width=0.7, legend_label=pt_columns, color=colors_fin)

    char_opt.char_options(p)

    if type != 'increase':
        #dodanie dodatkowych pol do tabeli przestawnej
        pivot_table_ma = pivot_table_ma.style.format(na_rep='MISSING',
                    formatter={
                               ('suma_wplat'): lambda x: "{: .0f} zł".format(x),
                               ('naklad_calkowity'): lambda x: "{: .0f}".format(x),
                               ('ROI'): lambda x: "{:,.2f} zł".format(x),
                               ('Stopa zwrotu l.w.'): lambda x: "{: .2f} %".format(x),
                                ('Stopa pozyskania'): lambda x: "{: .2f} %".format(x),
                               ('Koszt na głowę'): lambda x: "{: .2f} zł".format(x),
                               ('koszt_calkowity'): lambda x: "{: .0f} zł".format(x)
                               })
    return p, pivot_table_ma
Hi, a download latest version of streamlit and this problem stil happening. I have one more clue. This is going where on page is char. If char isn’t on page problem doesn’t show. Can you help me?
Hi, I still have problem with that shifting page. I really need help with that.
And I found one where important think, when I use bokeh chart, shifting is happening, but when I use plotly chart shifting don’t happened. Unfortunately I must use bokeh chart.