from pandas.io import excel
import streamlit as st
import pandas as pd
import numpy as np
import matplotlib.pyplot as plt
from PIL import Image
import altair as aa
#set_page_config sets a title on your window.
st.set_page_config(page_title="Data Finland")
#heading
st.markdown("<h1 style='text-align: center; { font-family: finlandica; } '>Data Finland!</h1><br>", unsafe_allow_html=True)
### --- LOAD DATAFRAME
excel_file = "data.xlsx"
data = pd.read_excel(excel_file,
usecols='A:B',
parse_dates=True)
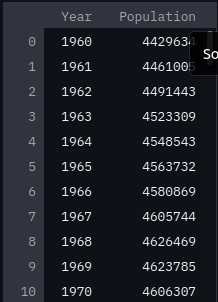
st.line_chart(data)
#raw data option
if st.checkbox("Show raw data"):
st.subheader("Raw data")
st.write(data)
Set the year column as the dataframe index, then plot.
You can use any of the more advanced charting APIs (pyplot, plotly_chart, altair_chart, vega_lite_chart, etc.) where you have control of which dataframe series is mapped to which axis. See here.
Yeah I will! not sure why but nothing happened when I added data.set_index('Year') but thanks anyway, imma go spend another night reading docs:D it is what it is.
I tried it, kinda like the way it looks. Great work.
When hovering the line of the chart it’s not responding so well because cursor has to be exactly right on that thin line to show the population of that certain year. Do you know how that can be fixed? It is not major issue but to create better user experience I would like it to be a bit more responsive.
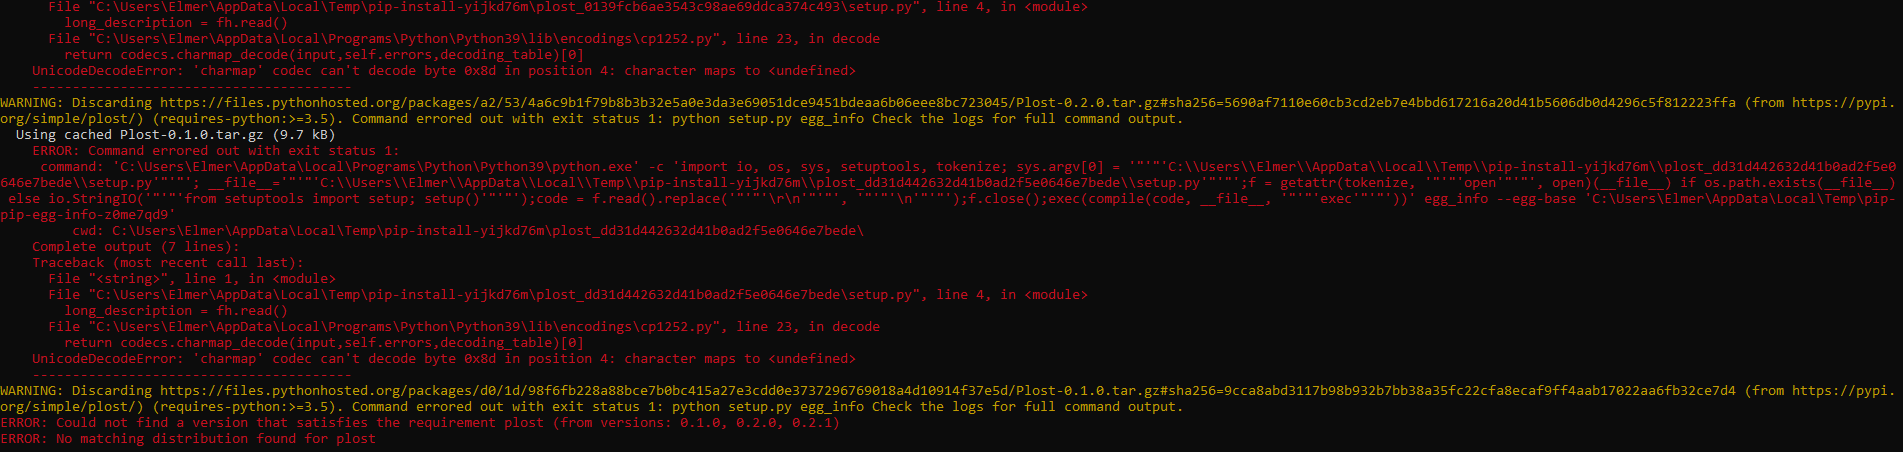
What’s strange is that the error message says Plost 0.2.0 and 0.1.0 have issues, but it doesn’t say anything about 0.2.1, which is the one that has the fix.
How are you installing this? pip install --upgrade plost ?
Ive tried pip install plost, pip install --upgrade plost, honestly any possible way that know of. It would be nice to know if anyone else is having the same issue, can’t find anything about Plost on google (not yet atleast)
I tried to fix that unicode error but didn’t work and also I have UTF-8 encoding installed to visual studio code like everyone else so that charmap error is throwing me off.
(requires-python:>=3.5) is weird too since I have 3.9
I uninstalled plost on my linux laptop and re-installed it successfully. Any windows device I have tried to installed plost with hasn’t worked.

 Plost!

 I’ve created a