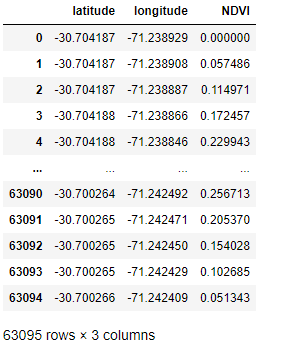
Hi everyone! i need some help with my streamlit project. Some days ago i made a shapefile to calculate NDVI from a satelital image. The shapefile’s dataframe have 63095 rows of data and contains ‘latitude’, ‘longituted’ and NDVI data. The rows mean every single point of the land of study. (here is a picture of dataframe)
I need to put that information into a map, to see NDVI variation and show it in the app, like this

it would help me a lot with my project, thanks!