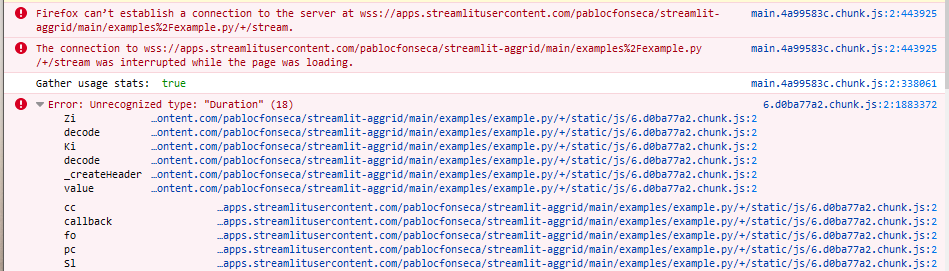
I seem to have traced the issue to this line of code
st.dataframe(grid_response['data'])
which is line 183 here:
import streamlit as st
import pandas as pd
import numpy as np
import altair as alt
from itertools import cycle

from st_aggrid import GridOptionsBuilder, AgGrid, GridUpdateMode, DataReturnMode, JsCode

np.random.seed(42)

@st.cache(allow_output_mutation=True)
def fetch_data(samples):
    deltas = cycle([
            pd.Timedelta(weeks=-2),
            pd.Timedelta(days=-1),
            pd.Timedelta(hours=-1),
            pd.Timedelta(0),
            pd.Timedelta(minutes=5),
            pd.Timedelta(seconds=10),
            pd.Timedelta(microseconds=50),
            pd.Timedelta(microseconds=10)
            ])
    dummy_data = {
        "date_time_naive":pd.date_range('2021-01-01', periods=samples),
        "apple":np.random.randint(0,100,samples) / 3.0,
        "banana":np.random.randint(0,100,samples) / 5.0,
        "chocolate":np.random.randint(0,100,samples),
        "group": np.random.choice(['A','B'], size=samples),
        "date_only":pd.date_range('2020-01-01', periods=samples).date,
        "timedelta":[next(deltas) for i in range(samples)],
        "date_tz_aware":pd.date_range('2022-01-01', periods=samples, tz="Asia/Katmandu")
    }
    return pd.DataFrame(dummy_data)

#Example controlers
st.sidebar.subheader("St-AgGrid example options")

sample_size = st.sidebar.number_input("rows", min_value=10, value=10)
grid_height = st.sidebar.number_input("Grid height", min_value=200, max_value=800, value=200)

return_mode = st.sidebar.selectbox("Return Mode", list(DataReturnMode.__members__), index=1)
return_mode_value = DataReturnMode.__members__[return_mode]

update_mode = st.sidebar.selectbox("Update Mode", list(GridUpdateMode.__members__), index=6)
update_mode_value = GridUpdateMode.__members__[update_mode]

#enterprise modules
enable_enterprise_modules = st.sidebar.checkbox("Enable Enterprise Modules")
if enable_enterprise_modules:
    enable_sidebar =st.sidebar.checkbox("Enable grid sidebar", value=False)
else:
    enable_sidebar = False

#features
fit_columns_on_grid_load = st.sidebar.checkbox("Fit Grid Columns on Load")

enable_selection=st.sidebar.checkbox("Enable row selection", value=True)
if enable_selection:
    st.sidebar.subheader("Selection options")
    selection_mode = st.sidebar.radio("Selection Mode", ['single','multiple'])

    use_checkbox = st.sidebar.checkbox("Use check box for selection")
    if use_checkbox:
        groupSelectsChildren = st.sidebar.checkbox("Group checkbox select children", value=True)
        groupSelectsFiltered = st.sidebar.checkbox("Group checkbox includes filtered", value=True)

    if ((selection_mode == 'multiple') & (not use_checkbox)):
        rowMultiSelectWithClick = st.sidebar.checkbox("Multiselect with click (instead of holding CTRL)", value=False)
        if not rowMultiSelectWithClick:
            suppressRowDeselection = st.sidebar.checkbox("Suppress deselection (while holding CTRL)", value=False)
        else:
            suppressRowDeselection=False
    st.sidebar.text("___")

enable_pagination = st.sidebar.checkbox("Enable pagination", value=False)
if enable_pagination:
    st.sidebar.subheader("Pagination options")
    paginationAutoSize = st.sidebar.checkbox("Auto pagination size", value=True)
    if not paginationAutoSize:
        paginationPageSize = st.sidebar.number_input("Page size", value=5, min_value=0, max_value=sample_size)
    st.sidebar.text("___")

df = fetch_data(sample_size)

#Infer basic colDefs from dataframe types
gb = GridOptionsBuilder.from_dataframe(df)

#customize gridOptions
gb.configure_default_column(groupable=True, value=True, enableRowGroup=True, aggFunc='sum', editable=True)

gb.configure_column("date_tz_aware", type=["dateColumnFilter","customDateTimeFormat"], custom_format_string='yyyy-MM-dd HH:mm zzz', pivot=True)

gb.configure_column("apple", type=["numericColumn","numberColumnFilter","customNumericFormat"], precision=2, aggFunc='sum')
gb.configure_column("banana", type=["numericColumn", "numberColumnFilter", "customNumericFormat"], precision=1, aggFunc='avg')
gb.configure_column("chocolate", type=["numericColumn", "numberColumnFilter", "customCurrencyFormat"], custom_currency_symbol="R$", aggFunc='max')

#configures last row to use custom styles based on cell's value, injecting JsCode on components front end
cellsytle_jscode = JsCode("""
function(params) {
    if (params.value == 'A') {
        return {
            'color': 'white',
            'backgroundColor': 'darkred'
        }
    } else {
        return {
            'color': 'black',
            'backgroundColor': 'white'
        }
    }
};
""")
gb.configure_column("group", cellStyle=cellsytle_jscode)

if enable_sidebar:
    gb.configure_side_bar()

if enable_selection:
    gb.configure_selection(selection_mode)
    if use_checkbox:
        gb.configure_selection(selection_mode, use_checkbox=True, groupSelectsChildren=groupSelectsChildren, groupSelectsFiltered=groupSelectsFiltered)
    if ((selection_mode == 'multiple') & (not use_checkbox)):
        gb.configure_selection(selection_mode, use_checkbox=False, rowMultiSelectWithClick=rowMultiSelectWithClick, suppressRowDeselection=suppressRowDeselection)

if enable_pagination:
    if paginationAutoSize:
        gb.configure_pagination(paginationAutoPageSize=True)
    else:
        gb.configure_pagination(paginationAutoPageSize=False, paginationPageSize=paginationPageSize)

gb.configure_grid_options(domLayout='normal')
gridOptions = gb.build()

#Display the grid
st.header("Streamlit Ag-Grid")
st.markdown("""
    AgGrid can handle many types of columns and will try to render the most human readable way.
    On editions, grid will fallback to string representation of data, DateTime and TimeDeltas are converted to ISO format.
    Custom display formating may be applied to numeric fields, but returned data will still be numeric.
""")

grid_response = AgGrid(
    df,
    gridOptions=gridOptions,
    height=grid_height,
    width='100%',
    data_return_mode=return_mode_value,
    update_mode=update_mode_value,
    fit_columns_on_grid_load=fit_columns_on_grid_load,
    allow_unsafe_jscode=True, #Set it to True to allow jsfunction to be injected
    enable_enterprise_modules=enable_enterprise_modules,
    )

df = grid_response['data']
selected = grid_response['selected_rows']
selected_df = pd.DataFrame(selected)

with st.spinner("Displaying results..."):
    #displays the chart
    chart_data = df.loc[:,['date_time_naive','apple','banana','chocolate']].assign(source='total')

    if not selected_df.empty:
        selected_data = selected_df.loc[:,['date_time_naive','apple','banana','chocolate']].assign(source='selection')
        chart_data = pd.concat([chart_data, selected_data])

    chart_data = pd.melt(chart_data, id_vars=['date_time_naive','source'], var_name="item", value_name="quantity")
    #st.dataframe(chart_data)
    chart = alt.Chart(data=chart_data).mark_bar().encode(
        x=alt.X("item:O"),
        y=alt.Y("sum(quantity):Q", stack=False),
        color=alt.Color('source:N', scale=alt.Scale(domain=['total','selection'])),
    )

    st.header("Component Outputs - Example chart")
    st.markdown("""
    This chart is built with data returned from the grid. rows that are selected are also identified.
    Experiment selecting rows, group and filtering and check how the chart updates to match.
    """)

    st.altair_chart(chart, use_container_width=True)

    st.subheader("Returned grid data:")
    st.dataframe(grid_response['data'])

    st.subheader("grid selection:")
    st.write(grid_response['selected_rows'])

    st.header("Generated gridOptions")
    st.markdown("""
        All grid configuration is done thorugh a dictionary passed as ```gridOptions``` parameter to AgGrid call.
        You can build it yourself, or use ```gridOptionBuilder``` helper class.
        Ag-Grid documentation can be read [here](https://www.ag-grid.com/documentation)
    """)
    st.write(gridOptions)
I tried replacing
st.dataframe(grid_response['data'])
with
st.write(grid_response['data'])
but no change.
I checked the dataframe size and it’s only 10 rows, 8 columns.
The table contains these types:
<class 'pandas._libs.tslibs.timestamps.Timestamp'>
<class 'float'>
<class 'int'>
<class 'str'>
<class 'datetime.date'>
<class 'pandas._libs.tslibs.timedeltas.Timedelta'>
And I found that if I drop the column timedelta with type timedelta64[ns] then the issue is solved.
Very interestingly, if I do st.write(data.dtypes) I get this error:
ArrowInvalid: ("Could not convert dtype('<M8[ns]') with type numpy.dtype:
did not recognize Python value type when inferring an Arrow data type",
'Conversion failed for column 0 with type object')

Traceback:
File "/usr/local/lib/python3.9/site-packages/streamlit/script_runner.py", line 354, in _run_script
    exec(code, module.__dict__)
File "/Users/mkleinbort/streamlit-showcase/qpp.py", line 199, in <module>
    st.write(x.dtypes)
File "/usr/local/lib/python3.9/site-packages/streamlit/elements/write.py", line 182, in write
    self.dg.dataframe(arg)
File "/usr/local/lib/python3.9/site-packages/streamlit/elements/dataframe_selector.py", line 85, in dataframe
    return self.dg._arrow_dataframe(data, width, height)
File "/usr/local/lib/python3.9/site-packages/streamlit/elements/arrow.py", line 82, in _arrow_dataframe
    marshall(proto, data, default_uuid)
File "/usr/local/lib/python3.9/site-packages/streamlit/elements/arrow.py", line 160, in marshall
    proto.data = type_util.data_frame_to_bytes(df)
File "/usr/local/lib/python3.9/site-packages/streamlit/type_util.py", line 372, in data_frame_to_bytes
    table = pa.Table.from_pandas(df)
File "pyarrow/table.pxi", line 1561, in pyarrow.lib.Table.from_pandas
File "/usr/local/lib/python3.9/site-packages/pyarrow/pandas_compat.py", line 594, in dataframe_to_arrays
    arrays = [convert_column(c, f)
File "/usr/local/lib/python3.9/site-packages/pyarrow/pandas_compat.py", line 594, in <listcomp>
    arrays = [convert_column(c, f)
File "/usr/local/lib/python3.9/site-packages/pyarrow/pandas_compat.py", line 581, in convert_column
    raise e
File "/usr/local/lib/python3.9/site-packages/pyarrow/pandas_compat.py", line 575, in convert_column
    result = pa.array(col, type=type_, from_pandas=True, safe=safe)
File "pyarrow/array.pxi", line 302, in pyarrow.lib.array
File "pyarrow/array.pxi", line 83, in pyarrow.lib._ndarray_to_array
File "pyarrow/error.pxi", line 99, in pyarrow.lib.check_status