I need help. I had an error message, No module named ‘geopandas’ when doing streamlit run my python program in my local computer, even i’ve done with pip install geopandas on my local computer.
Steps to reproduce
Code snippet:
import geopandas as gpd
If applicable, please provide the steps we should take to reproduce the error or specified behavior.
It may be that you have more than one environment/installation of python. To check, when you open your command terminal, before running streamlit run my_app.py, can you run pip list to make sure it does show geopandas installed?
If you can see geopandas in pip list and still get that error, can you try creating a clean environment or reinstalling the package?
If you don’t have Anaconda installed, you could use venv for example. For Windows cmd:
Open a terminal and change directory to your project directory
pip install venv # This installs an package to create and use environments
python -m venv myvenv # This creates a virtual environment named myvenv
myvenv\Scripts\activate.bat
You will see the command line prefixed with (myenv) to show you are now in that virtual environment. Run all the usual commands to update pip, install streamlit, and install geopandas. Then you streamlit run app.py
When you click Open Terminal you will be in a command line with that environment already activated.
You can either have Anconda install Streamlit and Geopandas (in between steps 2 and 3 using the list of packages on the right), or you can just pip install what you want in the terminal after step 4.
Your terminal is running a new python environment now (as you can see with the environment name in parentheses). Go ahead and pip install streamlit and geopandas. Then you can streamlit run your_app.py to use that new environment.
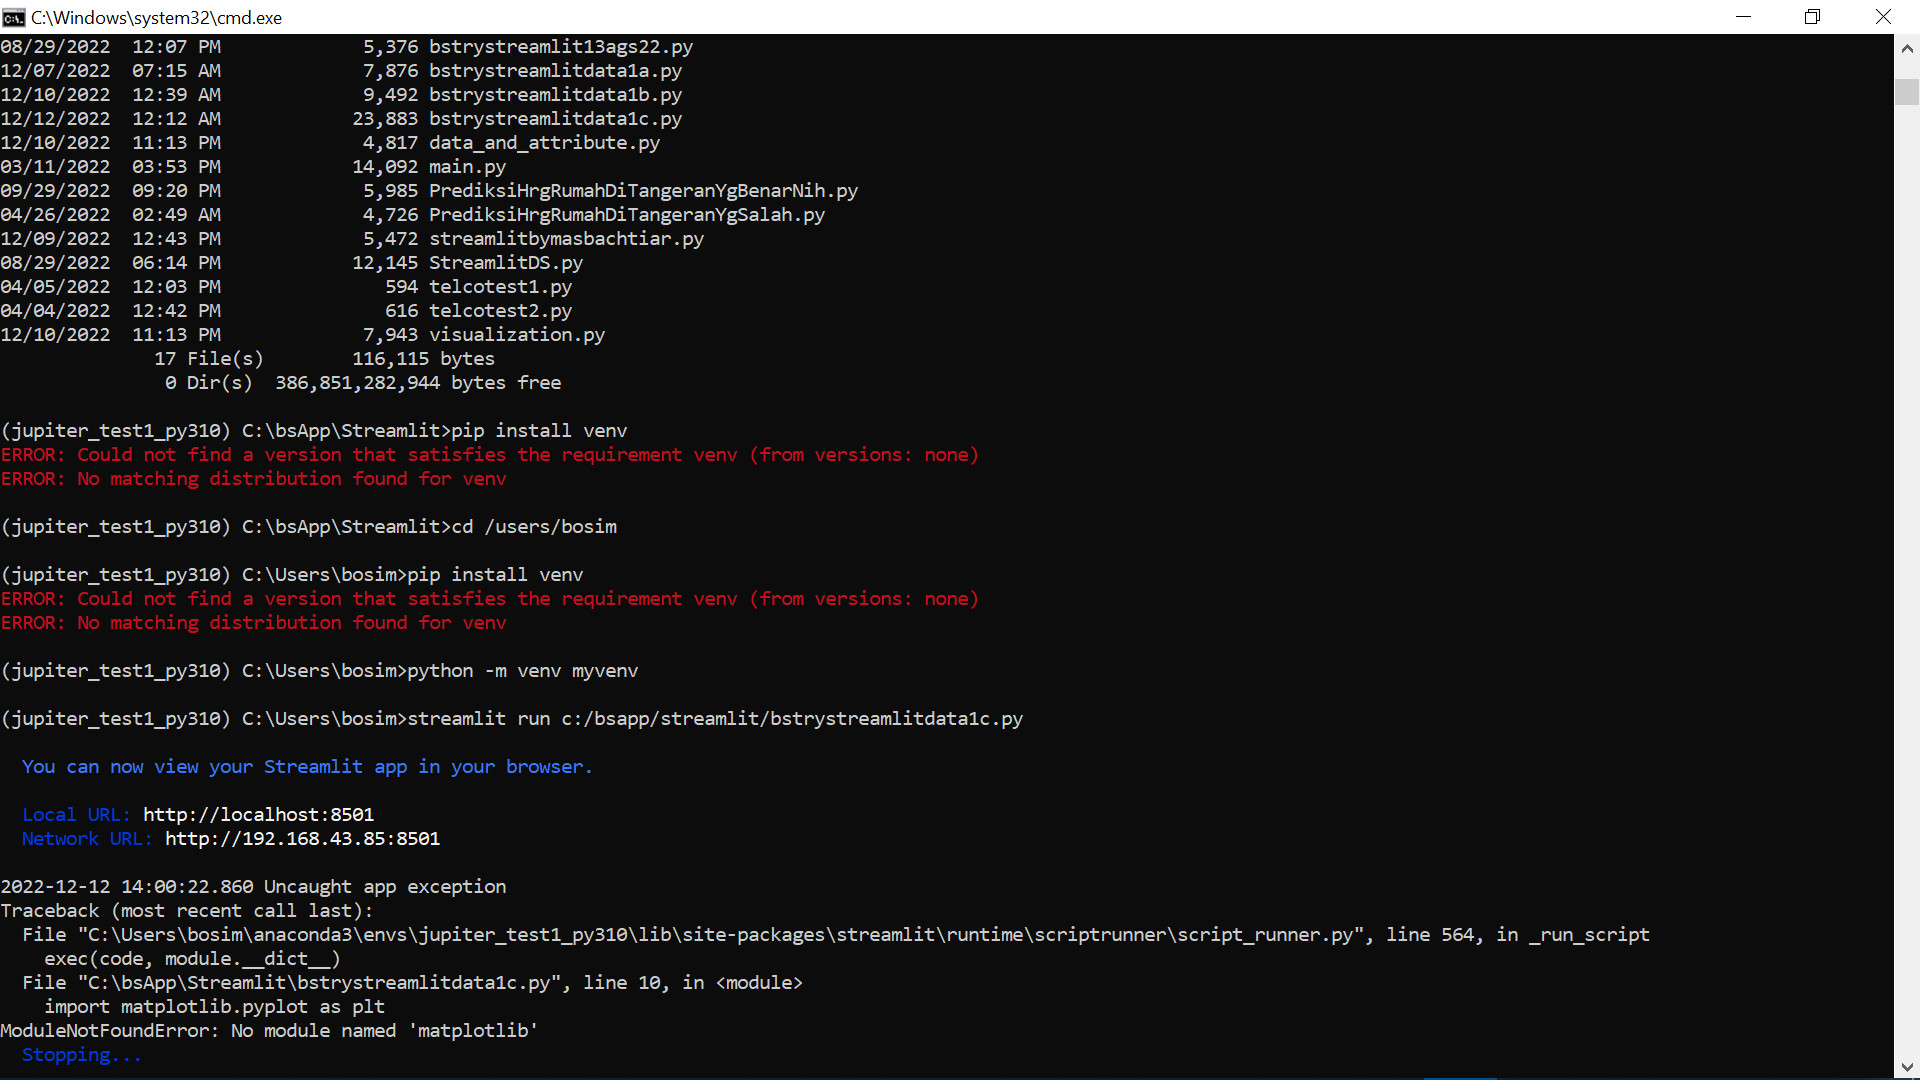
Ok, thx. I’ve installed Streamlit and Geopandas on that, and access streamlit run myapp.py on the directory of myapp.py, and have no problem again with geopandas. Now the problem is in Matplotlib. So, i have to install it again on the environment directory.
here is the coding: #bstrystreamlitdata1c.py (main program)
import os
import numpy as np
import pandas as pd
import streamlit as st #bsadded 11Des22
import matplotlib.pyplot as plt
import matplotlib.colors as pltc
from PIL import Image #import geopandas as gpd
import data_and_attribute
import aggregation as agg
import visualization as viz
#st.subheader('Streamlit App by https://www.linkedin.com/in/bosimanurung')
st.markdown("<p style='font-size:200%'><strong>Streamlit App by \
            <a href='https://www.linkedin.com/in/bosimanurung/'>Bosi Manurung</a></strong></p>", unsafe_allow_html=True)
#<p id="top"><a href="http://www.google.com/">Click Here To Go Google.com</a></p>

st.markdown("<p style='text-align:justify;'><strong><span style='font-size:105%'>\
            Key Performance Indicator (KPI)</span></strong> adalah alat ukur kuantitatif yang \
            menggambarkan efektivitas perusahaan. Tidak hanya soal seberapa \
            besarnya angka, namun juga apakah performa perusahaan sudah sesuai \
            dengan tujuan bisnis yang diharapkan sebelumnya. <strong><span style='font-size:105%'> \
            DQ-MarketPlace</span></strong> adalah sebuah \
            perusahaan yang bergerak di bidang retail (bisnis yang melibatkan \
            penjualan barang atau jasa kepada konsumen dalam jumlah satuan/eceran) \
            yang menetapkan tiga kriteria KPI-nya yakni Total Revenue, New Customer Growth \
            dan Best Seller Product (dalam jangka waktu bulan tertentu). Dengan mengukur \
            ketiga KPI tersebut diharapkan perusahaan mampu mengevaluasi performa \
            bisnis dan merencanakan strategi berikutnya.</p>", unsafe_allow_html=True)

st.markdown("<p style='text-align:justify;'>Data sumber adalah file retail_raw_reduced.csv yang berasal dari API dataset <a href='https://dataset.dqlab.id'>dqlab.</a> Bila ingin mendownload file tersebut, \
            silakan klik <a href='https://dataset.dqlab.id/retail_raw_reduced.csv'>link</a> ini.</p>", unsafe_allow_html=True)
sidebar di kiri
st.sidebar.markdown(“Silakan Isi parameter berikut :”)
atributProvinsi = st.sidebar.selectbox(‘Pilih Provinsi’, attributeProvince) #attributeProvince ada di atas #print(atributProvinsi) #variabel tsb akan menampung pilihan user, bila diprint akan terlihat
#filter data sampah berdasarkan provinsi
dataretailprovinsi = dataretail.loc[dataretail[‘province’] == atributProvinsi]
dataretailprovinsi = dataretailprovinsi.reset_index(drop=True) #spy indexnya kembali ke 0 bila pilih provinsi baru
#baris 2 - Tampilkan datanya (bikin variabel baru)
row2_spacer1, row2_1, row2_spacer2 = st.columns((0.02, 3, 0.02))
with row2_1:
st.subheader(‘Data yang digunakan’)
st.dataframe(dataretailprovinsi) #st.markdown(“Deskripsi kolom dari tabel tersebut adalah:”, unsafe_allow_html=True) #st.markdown(“1. order_id : ID dari order atau transaksi. Satu ID bisa terdiri dari beberapa produk, tapi hanya untuk 1 customer.”, unsafe_allow_html=True)
#st.markdown("Deskripsi kolom dari tabel tersebut adalah:")
#st.dataframe(dataretail_strukturdata.style.hide_index())
#st.write("order_id    : ID dari order/transaksi. Satu ID atau order/transaksi bisa terdiri dari beberapa produk yang dipesan. ",
         #"order_date  : Tanggal order/transaksi.")
#baris 3 - Tampilkan Keterangan datanya (bikin variabel baru)
style = dataretail_strukturdata.style.hide_index() #dataretail_strukturdata.set_index(‘column’, inplace=True)
row3_spacer1, row3_1, row3_spacer2 = st.columns((0.02, 3, 0.02))
with row3_1:
st.markdown(“Deskripsi kolom dari tabel tersebut adalah:”) #st.dataframe(dataretail_strukturdata.style.hide_index())
#st.write(style.to_html(), unsafe_allow_html=True)
#st.dataframe(dataretail_strukturdata)

kolomdesc = '\n1.  order_id\t: ID dari order atau transaksi, 1 transaksi bisa terdiri dari beberapa produk, tetapi hanya dilakukan oleh 1 customer\
             \n2.  order_date\t: tanggal terjadinya transaksi\
             \n3.  customer_id\t: ID dari pembeli; bisa jadi dalam satu hari, 1 customer melakukan transaksi beberapa kali\
             \n4.  city\t: kota tempat toko terjadinya transaksi\
             \n5.  province\t: provinsi (berdasarkan city)\
             \n6.  product_id\t: ID dari suatu product yang dibeli\
             \n7.  brand\t: brand/merk dari product. Suatu product yang sama pasti memiliki brand yang sama\
             \n8.  quantity\t: Kuantitas/banyaknya product yang dibeli\
             \n9.  item_price\t: Harga dari 1 product (dalam Rupiah). Suatu product yang sama, bisa jadi memiliki harga yang berbeda saat dibeli\
             \n10. total_price\t: Hasil kali barang dibeli (quantity) dengan harga barang (item_price)'
st.text(kolomdesc)
#data_and_attribute.py :
import os
os.path.dirname(os.path.realpath(‘file’))
import calendar
import numpy as np
import pandas as pd
import geopandas as gpd
class Data():
def __init__(self):
    #Proses ekstrak data
    self.dataSourceRaw   = pd.read_csv('c:/bsapp/streamlit/retail_raw_reduced.csv')
    self.dataGeo         = self.geoMaps()
    self.dataSourceClean = self.__TransformAndCleansing()

def __TransformAndCleansing(self):
    data    = self.dataSourceRaw
    datageo = self.dataGeo[['province', 'district']]
    datageo = datageo.rename(columns = {'province' : 'provinsi'})
    data    = data.merge(datageo, how = 'left', left_on = 'city', right_on = 'district')

    #Proses transformasi dan cleansing
    data = data.dropna(subset = ['order_id'])
    data[['order_id', 'customer_id']] = data[['order_id', 'customer_id']].astype('str')
    data['province']   = np.where(data['province'].isnull(), data['provinsi'], data['province'])
    data['city']       = np.where(data['city'].isnull(), 'N/A - ' + data['province'], data['city'])
    data['order_date'] = pd.to_datetime(data['order_date'], format = '%d/%m/%Y')
    data = data.drop(columns = ['provinsi', 'district'])

    #Penambahan kolom
    data['total_price'] = data['quantity'] * data['item_price']
    data.insert(loc = 2, column = 'order_year' , value = data['order_date'].dt.year)
    data.insert(loc = 2, column = 'order_month', value = data['order_date'].dt.month_name())
    return data

def __toList(self, value):
   if(isinstance(value, str)):
       value = value.split(',')
   else:
       value = list(value)
   return value

def __filterCol(self, **parameter):
    data = parameter.get('data')
    rec  = parameter.get('rec')
    if (rec is not None):
        col  = parameter.get('col')
        try :
            record = self.__toList(rec)
            data   = data[data[col].isin(record)]
        except:
             pass
    return data.reset_index(drop = True)

def getDataRetail(self, **parameter):
    #Assignment ke variabel lain
    data    = self.dataSourceClean

    #Filter data berdasarkan kota atau provinsi
    data = self.__filterCol(data = data, col = 'city', rec = parameter.get('city'))
    data = self.__filterCol(data = data, col = 'province', rec = parameter.get('province'))
    data = self.__filterCol(data = data, col = 'order_month', rec = parameter.get('month'))

    return data

def geoMaps(self, **parameter):
    os.path.dirname(os.path.realpath('__file__'))
    datageo = gpd.read_file('gadm36_IDN_2.shx')
    datageo = datageo.rename(columns = {'NAME_1' : 'province', 'NAME_2' : 'district'})
    datageo = datageo[['province', 'district', 'geometry']]
    datageo = datageo[~datageo['district'].isin(['Kepulauan Seribu', 'Waduk Kedungombo'])]

    for m, n in {'Kota Yogyakarta' : 'Yogyakarta', 'Jakarta Raya' : 'DKI Jakarta'}.items():
        datageo['province'] = datageo['province'].str.replace(m, n)
        datageo['district'] = datageo['district'].str.replace(m, n)

    datageo = self.__filterCol(data = datageo, col = 'province', rec = parameter.get('province'))
    return datageo

def __getAttr(func):
    def filterAttribute(self, **parameter):
        #Untuk attribute city --> filter berdasarkan provinsi dipilih
        province = parameter.get('province')
        if(province is not None):
            province = self.__toList(province)
            data     = self.dataSourceClean[self.dataSourceClean['province'].isin(province)]
        else:
            data = self.dataSourceClean

        #Untuk attribute lain
        data = data[func(self)] if isinstance(func(self), str) else data[func(self)[0]]
        data = data.dropna().drop_duplicates()
        data = data.sort_values(ignore_index = True).to_list()
        if(func(self) == 'order_month'):
            data = sorted(data, key = list(calendar.month_name).index)
        return data
    return filterAttribute

@__getAttr
def getAttrProvince(self):
    return('province')

@__getAttr
def getAttrCity(self, province = None):
    return('city', province)

@__getAttr
def getAttrMonth(self):
    return('order_month')

@__getAttr
def getAttrYear(self):
    return('order_year')
Finally, i’ve found the solution about the file gadm36_IDN.shp (gadm36_IDN.shx in the coding i’ve sent before).
I found explanation here:
below small title Step 2: Download Datasets
there is an explanation that GADM (gadm) is GeoJSON format that we should download for specific country (province in a country)
and from this link: GADM we can download it (the file gadm36_IDN.shp that is needed to show the result map. Thank you so much.