I’ve recently started to learn Streamlit and loved it.
As a toy project I’ve put together a small analysis of winter climate in the city of Almaty, Kazakhstan based on 100 years of daily mean air temperature observations from 1922 to 2022. This Dashboard includes time series, distribution and other types of graphical comparisons - you can check distributions of different time periods, or see development of aggregated 100 years air temperature versus selected period.
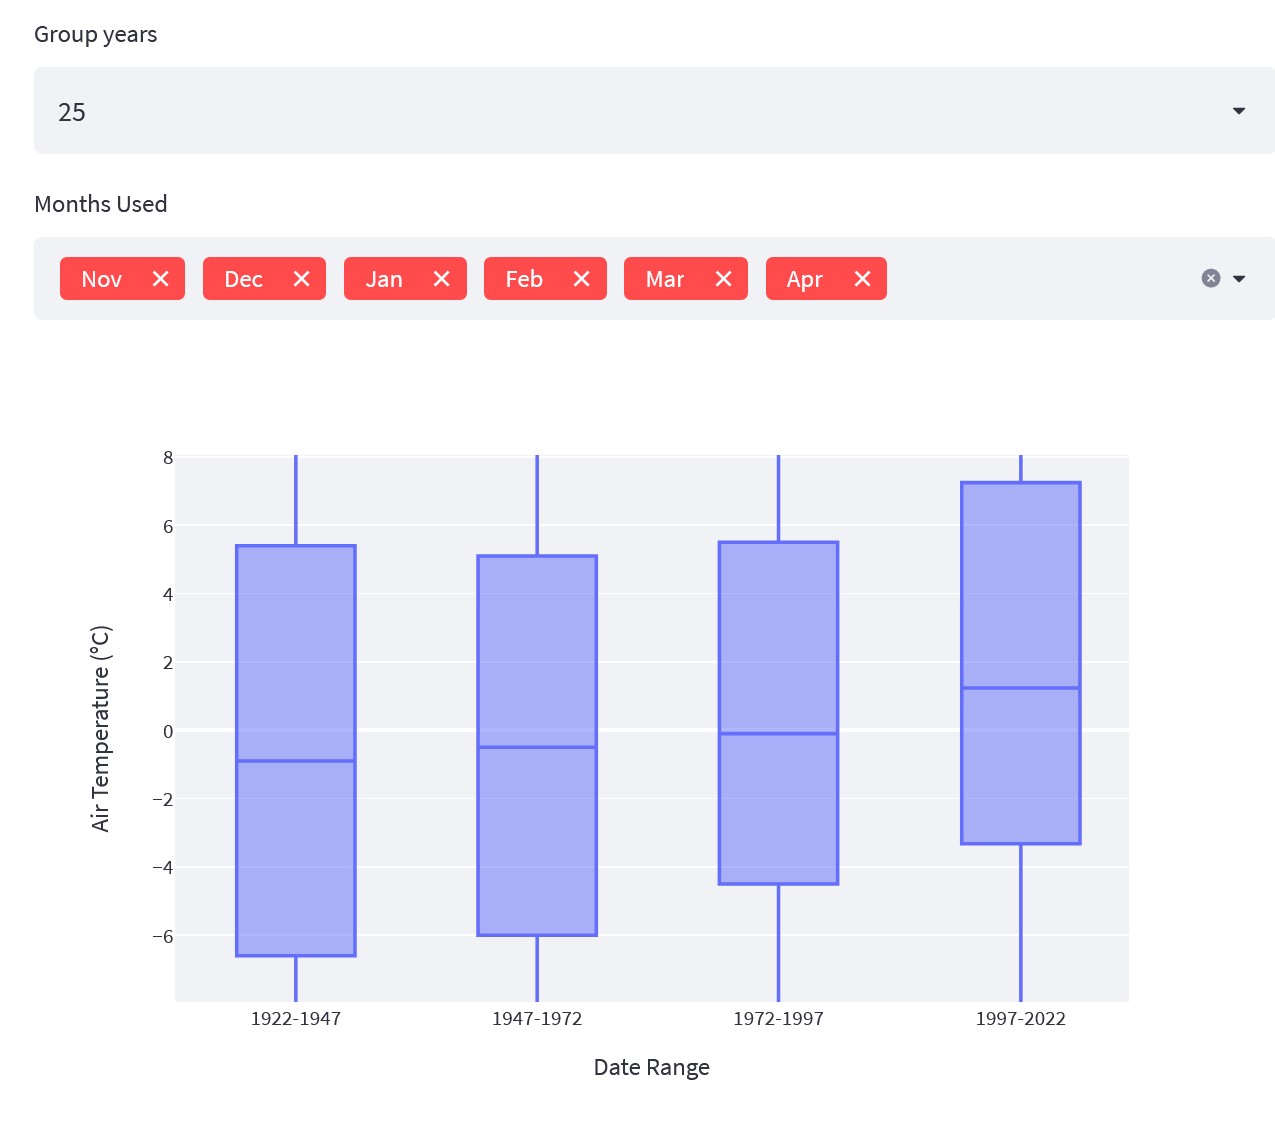
The main conclusion is that the winters are getting warmer, as I was expecting ![]()
For winter severity index I used Freezing Degree Days (FDD) and ran Mann-Kendall test to assess the statistical significance of the winter severity trend.